
Hoops
Is Le’Bryan Nash a bad big-game player?

Photo Attribution: Emily Nielsen
Kyle asked me to take a look at how Nash & Smart played in big games compared to games against weaker opponents. I decided to throw in Markel as well since he’s playing at an all-conference level this year.
I took a different approach this time around. I used Dean Oliver’s offensive rating, as calculated by Ken Pomeroy. Here’s how Pomeroy describes it on his site:
Offensive rating (ORtg): A measure of personal offensive efficiency developed by Dean Oliver. The formula is very complicated, but accurate. For a detailed explanation, buy Basketball on Paper.
Let’s just take his word for it. The only thing I don’t like about this stat is that it’s kind of hard to quickly determine what a good figure is without comparing it to other players (Smart has an offensive rating of 103.3. Out of context, it doesn’t mean a thing).
I didn’t want to simply find games where players were efficient, though…I wanted to find games where the players really showed up and played well. Here was my approach: I multiplied each players offensive rating times the % of possessions the player used in each game. The higher the result, the more positive an impact the player had in that game.
Here’s an example. Let’s use the single-best game in this category by an OSU player this year: Markel’s dominating performance at Texas Tech (25 points on 11 shots, 2 rebounds, 4 assists). Markel had an offensive rating of 192 (for context, the leading player in the country has a season average of 128). He was involved in 31% of the team’s possessions that day. So his stat for the purposes of this post is 192 * 31% = 59.5. No one has topped this mark so far this year.
On the other hand, let’s look at the worst game by this group of three: Le’Bryan’s no-show against West Virginia at GIA. He played 25 minutes but he was 0-4 from the field and scored only 2 points. His offensive rating was 66 and he used 9% of the team’s possessions, so his stat for this post is 66 * 9% = 5.9.
Now, the real question: who has the most good games against good opponents. To the scatter-plot machine!
In all of these charts, the best games are at the top and the worst games are at the bottom. Opponent strength is highest at the left side and lowest at the right.
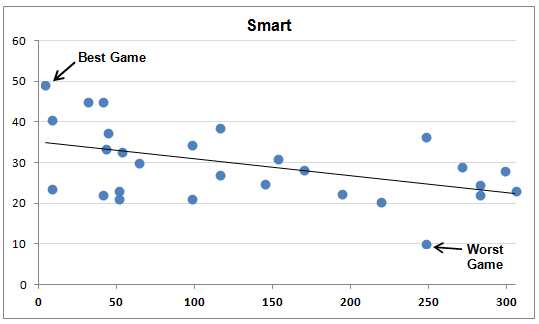
Marcus Smart had his best game of the year against our toughest opponent, Gonzaga (23 points on 15 shots, 4 rebounds, 6 assists). It’s really not that spectacular of a stat line for Smart, but he was involved in 40% of the team’s possessions that day. His worst game came in a 34-point win over Texas Tech at home.
His trendline is higher against our better opponents, meaning that he has played his best games in OSU’s biggest games this year.
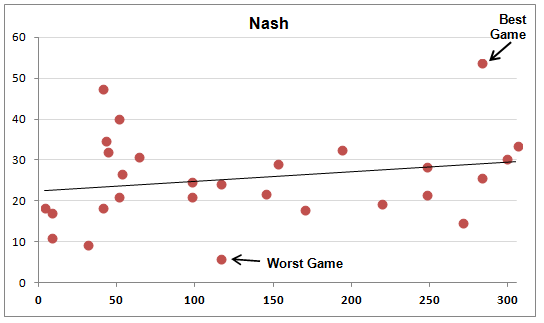
Nash, on the other hand, has generally played better against weaker opponents. His monster game at TCU stands out quite a bit here…28 points on 16 shots and 6 rebounds. However, his recent improvement has given him a solid group of games against solid opponents (bedlam at home, the loss at Baylor, Iowa State). I don’t think him not showing up in big games is a valid criticism at this point.
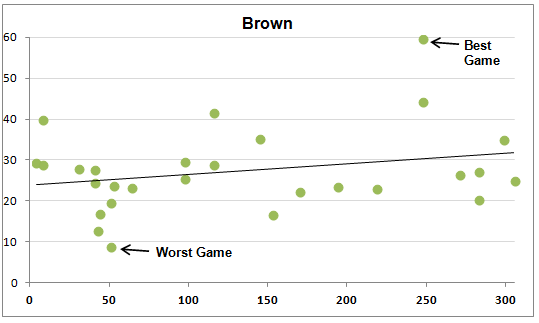
Markel’s best game was at Texas Tech. His worst game was his stinker at Baylor (2 points on 10 shots – ouch!). Markel has a slightly higher average than Nash and a slightly lower standard deviation, meaning that he has played on average better and more consistently than Nash.
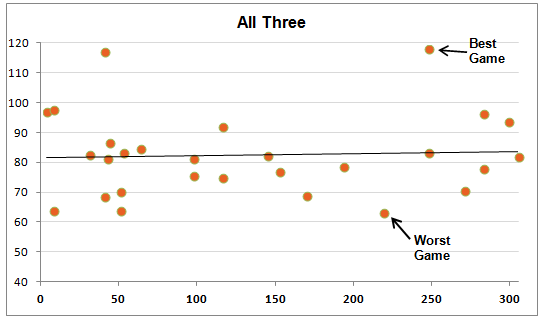
Here’s all three of these guys together. Their best game was the blowout win at Texas Tech, trailed closely by the very next game at home against OU. Their worst game was a 20-point win over Missouri State (whatever) followed closely by the home loss to Kansas. The low figures in that loss were mostly caused by low shooting percentage (the three guys combined for 12 for 39 shooting in that game — how were we in it again?).
But the three guys together have been remarkably consistent this year. Aside from the two outstanding games, most of them have been close to the trendline in the middle. It leans slightly higher against our weaker opponents, but there are plenty of good games in our biggest contests.
They’re all big from here on out…here’s to more downward sloping trendlines in our future.


The Top 5 Quotes from John Smith’s Retirement News Conference

OSU Wrestling: How John Smith Started a Tradition of Late-Night Workouts For Cowboys Seeking World Glory

OSU Wrestling: The Impact John Smith Had on His Final Boss, Chad Weiberg

Justin McBride Enters Transfer Portal

The Top 5 Quotes from Mike Gundy’s Tuesday News Conference

OSU Wrestling: Olympic Chances End for Cowboy Hopefuls

Four-Star Wide Receiver Jaden Perez Commits to Oklahoma State

Daily Bullets (Apr. 19): Bedlam Gametime Moved, Cowboy Receivers Breed Confidence

Notebook: Stribling Back, Clay Squatting 635 and Glass Fitting in Well

OSU Wrestling: After Disappointing College Career Ending, Daton Fix Eyes Bigger Goal at Olympic Team Trials
-
 Wrestling5 days ago
The Top 5 Quotes from John Smith’s Retirement News Conference
-
 Wrestling3 days ago
OSU Wrestling: How John Smith Started a Tradition of Late-Night Workouts For Cowboys Seeking World Glory
-
 Wrestling4 days ago
OSU Wrestling: The Impact John Smith Had on His Final Boss, Chad Weiberg
-
 Hoops5 days ago
Justin McBride Enters Transfer Portal