
Football
Stat of the Week: Cowboys Seeing Decrease in Successful Drive Percentage
Oklahoma State’s offensive statistics show a startling drop in efficiency since they started Big 12 play. This is all despite averaging 13 drives per game over this season and still being third in the conference in points per game. Here’s a table showing their successful drive percentage up to this point in the season.
| Opponent | Successful Drives / Total Drives (*not counting kneeling possessions) | Successful Drive Percentage | Game Result |
| Missouri State | 9/16 (8 TD, 1 FG) | 56.25% | W |
| South Alabama | 8/15 (6 TD, 2 FG) | 53% | W |
| Boise State | 7/10 (4 TD, 3 FG)* | 70% | W |
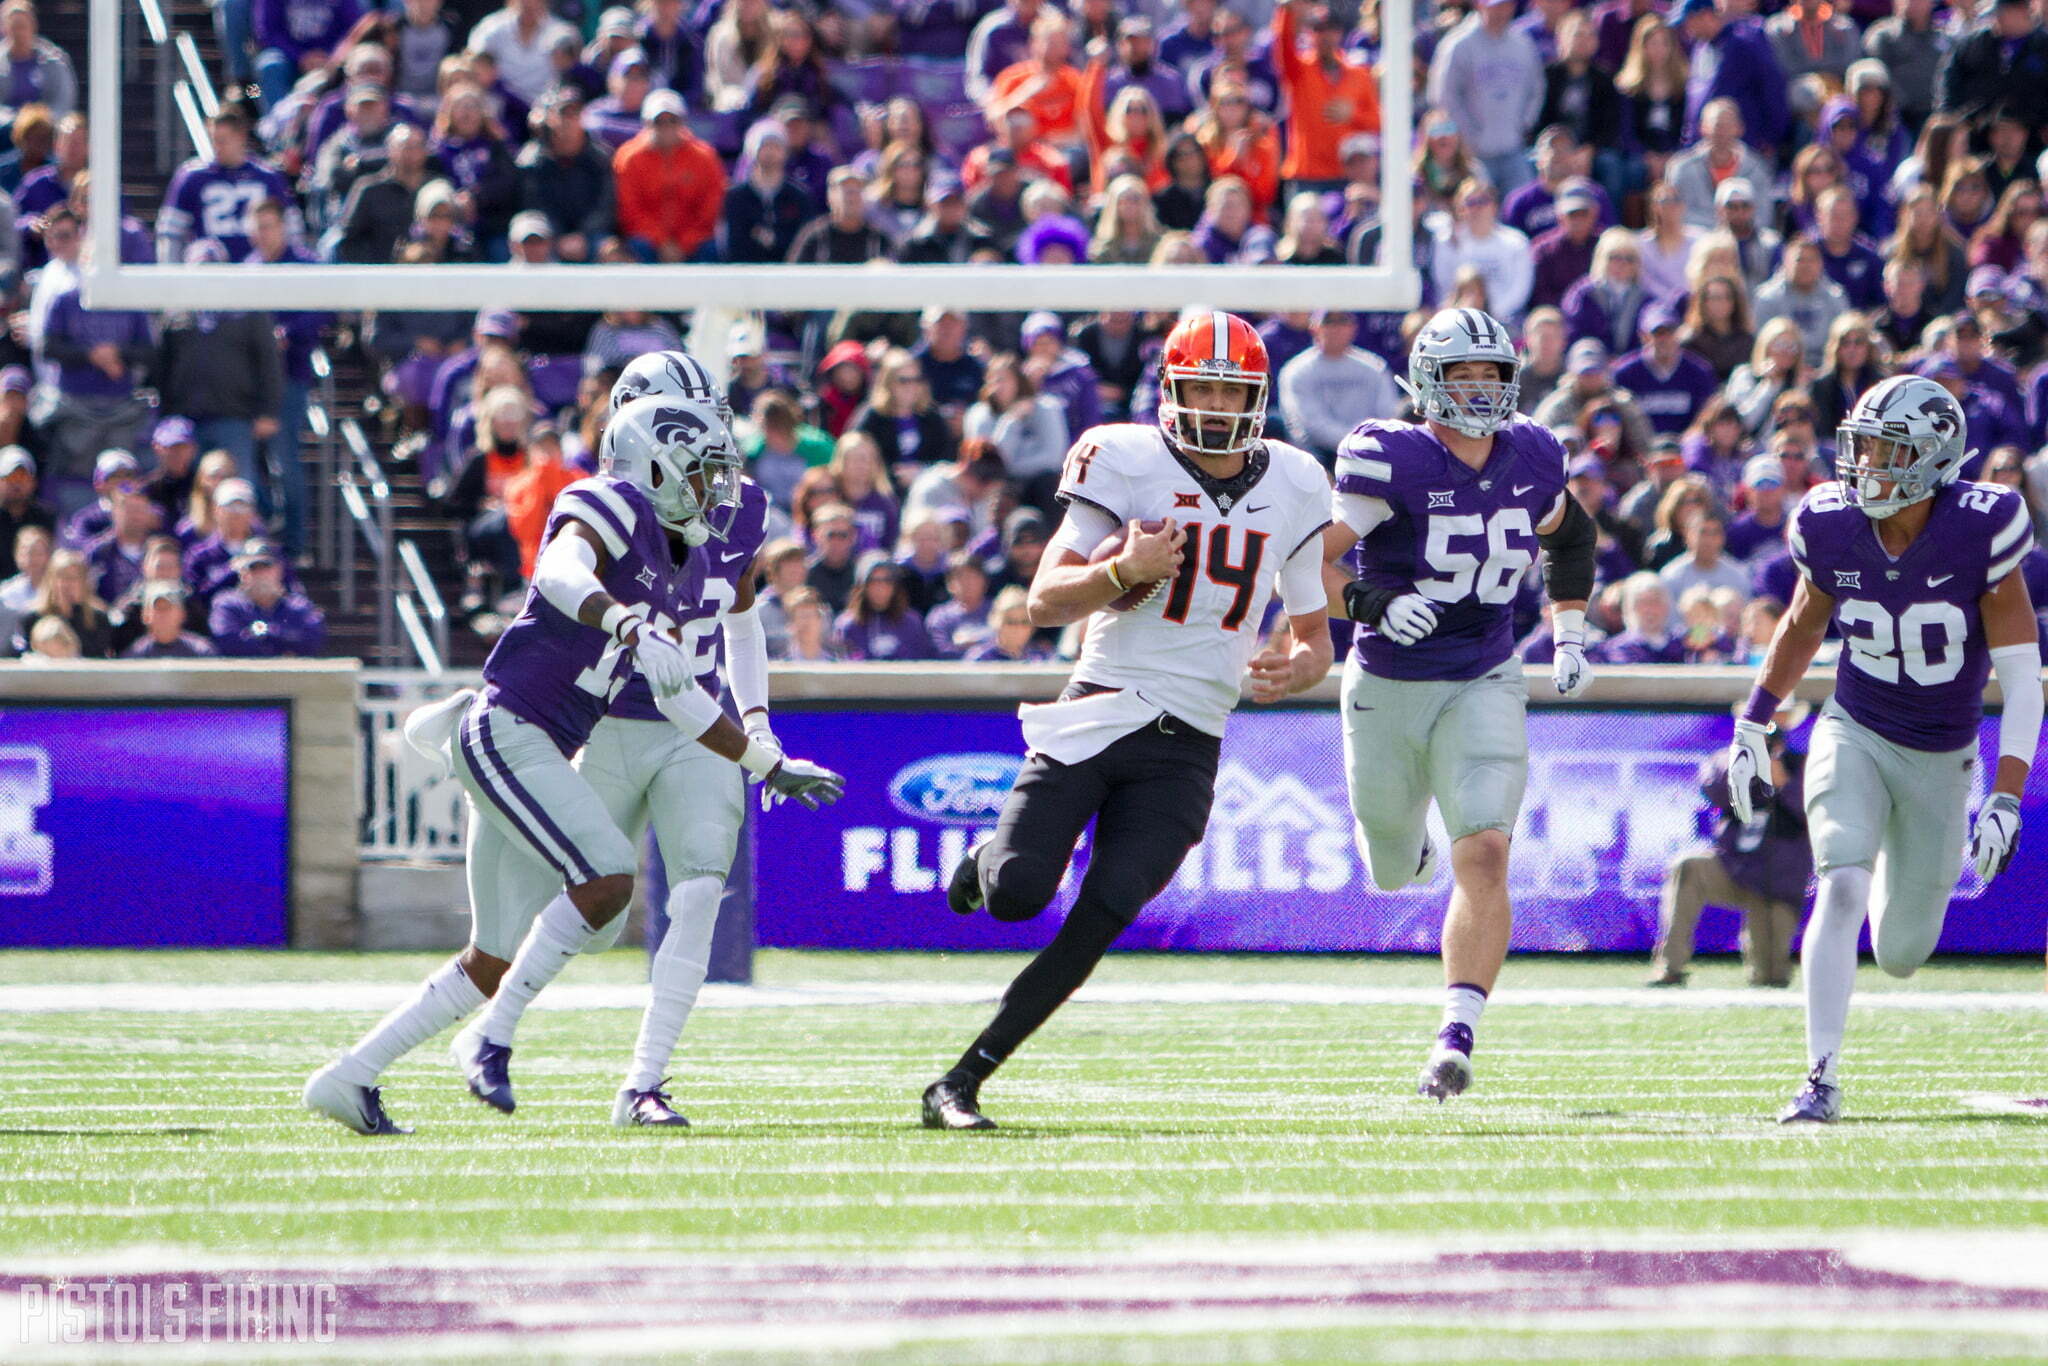
| Texas Tech | 3/12 (2 TD, 1 FG) | 25% | L |
| Kansas | 8/13 (6 TD, 2 FG)* | 61.5% | W |
| Iowa State | 6/16 (6 TD, 0 FG) | 37.5% | L |
| Kansas State | 3/10 (1 TD, 2 FG) | 30% | L |
The Cowboys’ season successful drive rate is 47.8 percent, but it’s only 38 percent through the past four games. To put that in perspective, OSU’s offense scored on 54 percent of their drives last year (not including kneeling possessions) on the same amount of drives per game.
Notice that in all of the Cowboys’ wins, their successful drive percentage is all above 50 percent. Conversely, all of their wins are in the 30-percent range or below.
In the Pokes’ most recent game, they only mustered three scoring drives against the No. 85 team in the FBS in total defense. They plan to take on a Texas team that’s in the top half of the conference in total, rushing and scoring defense. Hopefully they won’t continue on this downward trajectory, but the hope for improvement comes with Texas, TCU, West Virginia and Oklahoma all still on the schedule.


The Top 5 Quotes from John Smith’s Retirement News Conference

Wide Receiver Prospect Kameron Powell Commits to Oklahoma State

OSU Wrestling: How John Smith Started a Tradition of Late-Night Workouts For Cowboys Seeking World Glory

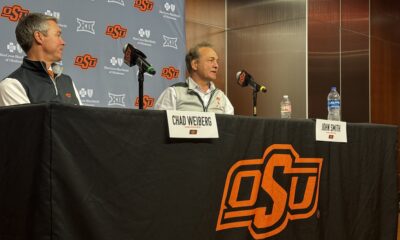
OSU Wrestling: The Impact John Smith Had on His Final Boss, Chad Weiberg

Report: Former Arkansas Guard Davonte Davis to Visit Oklahoma State

Daily Bullets (Apr. 19): Bedlam Gametime Moved, Cowboy Receivers Breed Confidence

Notebook: Stribling Back, Clay Squatting 635 and Glass Fitting in Well

OSU Wrestling: After Disappointing College Career Ending, Daton Fix Eyes Bigger Goal at Olympic Team Trials

Daily Bullets (Apr. 18): John Smith’s Early Morning Work, OSU after an OSU Running Back?
OSU Wrestling: How John Smith Started a Tradition of Late-Night Workouts For Cowboys Seeking World Glory
-
 Wrestling4 days ago
The Top 5 Quotes from John Smith’s Retirement News Conference
-
 Football5 days ago
Wide Receiver Prospect Kameron Powell Commits to Oklahoma State
-
 Wrestling2 days ago
OSU Wrestling: How John Smith Started a Tradition of Late-Night Workouts For Cowboys Seeking World Glory
-
 Wrestling4 days ago
OSU Wrestling: The Impact John Smith Had on His Final Boss, Chad Weiberg