
Hoops
The Leap
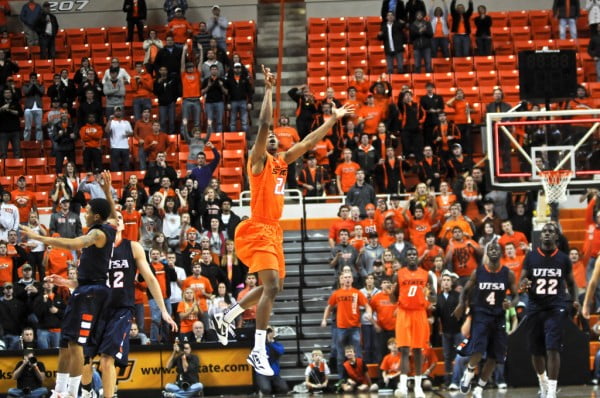
 Photo Attribution: Emily Nielsen
One of the biggest misconceptions about collegiate athletes is that they continue to improve at the same rate each year they are in school.
The reality is closer to what Gottlieb has referenced multiple times: that the leap you make from your freshman year to your sophomore year is bigger than any other single year improvement you’ll make the rest of your college career.
OSU has had numerous examples of this and it’s one reason next season is so enticing to me.
James Anderson went from 13 points/4 rebounds his freshman year to 18 points/6 rebounds in his second season. Joe Adkins made the jump from a 4-1-2 line his first season in Stillwater to a healthy 13-3-4 in his second (albeit in about twice the minutes). Even JamesOn Curry, who had a wildly successful freshman campaign, bumped his numbers from 9-3-3 to 14-3-4 in year two.
But what about current players? What can we expect from the guys on the current roster?
Let’s use Markel Brown as our measuring stick and look at the jump he made from last year to this year…
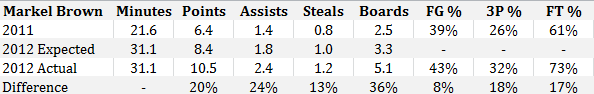
Let me explain what each line means.
2011 – His stats from last season (his freshman year).
2012 Expected – What we would have expected his stats to look like based solely on an increase in playing time from 21 MPG to 31 MPG.
2012 Actual – What his stats actually were this season (his sophomore year).
Difference – His improvement in each category* independent of a playing time increase.
As you can see, Markel improved in every area of his game independent of the fact that he got more playing time and more touches this season. His improvement was extreme in some cases (assists, boards, and FT%) and less in others (steals, FG%). He actually regressed in shot blocking but since “having our two guards block more shots” isn’t something I’m terribly worried about for next season, I didn’t include it.
So let’s take those MPG-independent numbers and apply them to Brian Williams, LeBryan Nash, and Mike Cobbins for next season. I’ll go ahead and assume they play the same amount of time as they did this year (which was a lot).

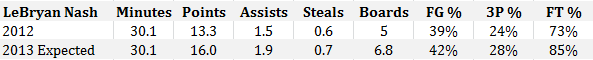

Pretty good, right?
12 and five from Brian Williams? 16 and seven from Bry-Bry? Almost 10 boards from Cobbins? Yes, I’ll take all of that.
HOWEVER, there are a few factors at work here that make me think these 2013 projections might be a bit inflated:
1. Williams and Cobbins weren’t freshmen this year in the same way Markel was last year because they redshirted so their improvement might not be as extreme.
2. I think you erase a little of the offseason improvement because of how much these guys played this year. Markel only played 21 minutes a game last year so there was a lot of room for growth, not so much with this trio.
I think people are going to be stunned at how much better Nash is next year though. And if Marcus Smart can lead the way everybody says he can, well…it could be a special year for the Cowboys.
*The shooting percentage improvements look a bit odd because I used the formula ((2012 percentage – 2011 percentage)/2012 percentage) to get a true improvement, or a number I could apply to all the other players.


Four-Star Quarterback Adam Schobel Commits to Oklahoma State, Flips from Baylor

‘Keep Turning Over the Rocks’: Looking at the Portal Landscape as Lutz Looks to Solidify His First OSU Roster

OSU Wrestling: Olympic Chances End for Cowboy Hopefuls

Four-Star Signee Jeremiah Johnson Reaffirms Commitment to Oklahoma State after Coaching Change

Daily Bullets (Apr. 23): Pokes Land Four-Star Quarterback, Retain Talent from Mike Boynton Era

OSU Freshman Preston Stout Sinks Long Putt to Earn Share of Big 12 Title

Austrailian Punter Hudson Kaak Details Transition to Stillwater, Football

FIU Transfer Arturo Dean Commits to Oklahoma State

Former Florida International Point Guard Arturo Dean Visits OSU

Daily Bullets (Apr. 24): Point Guard on Campus in Stillwater, Gundy on NCAA to NFL Transition
-
 Football2 days ago
Four-Star Quarterback Adam Schobel Commits to Oklahoma State, Flips from Baylor
-
 Hoops2 days ago
‘Keep Turning Over the Rocks’: Looking at the Portal Landscape as Lutz Looks to Solidify His First OSU Roster
-
 Wrestling5 days ago
OSU Wrestling: Olympic Chances End for Cowboy Hopefuls
-
 Hoops2 days ago
Four-Star Signee Jeremiah Johnson Reaffirms Commitment to Oklahoma State after Coaching Change