
Football
A Barry Sanders Chart That Displays Chuba Hubbard’s Greatness
Chuba is chasing ghosts and housing his competition.
Visuals are often overrated, but not when OKC Dave is building them. I’ve spilled 5,000 or 50,000 or 500,000 words trying to capture just how good Chuba Hubbard has been this season. Dave just puts the numbers into Google Sheets using three words, and it makes a lot more sense than when I say it.
Obviously everyone knows Chuba is having one of the all-time great seasons in a long line of them at Oklahoma State. But did you know how closely he’s tracking Barry to this point? Again, I’ve written about this and taken screenshots of their stats and yelled about it on our podcast, but this chart of Barry’s 1988 season in the blue and Chuba’s 2019 season in the orange does all the work for me.
Here’s a look.
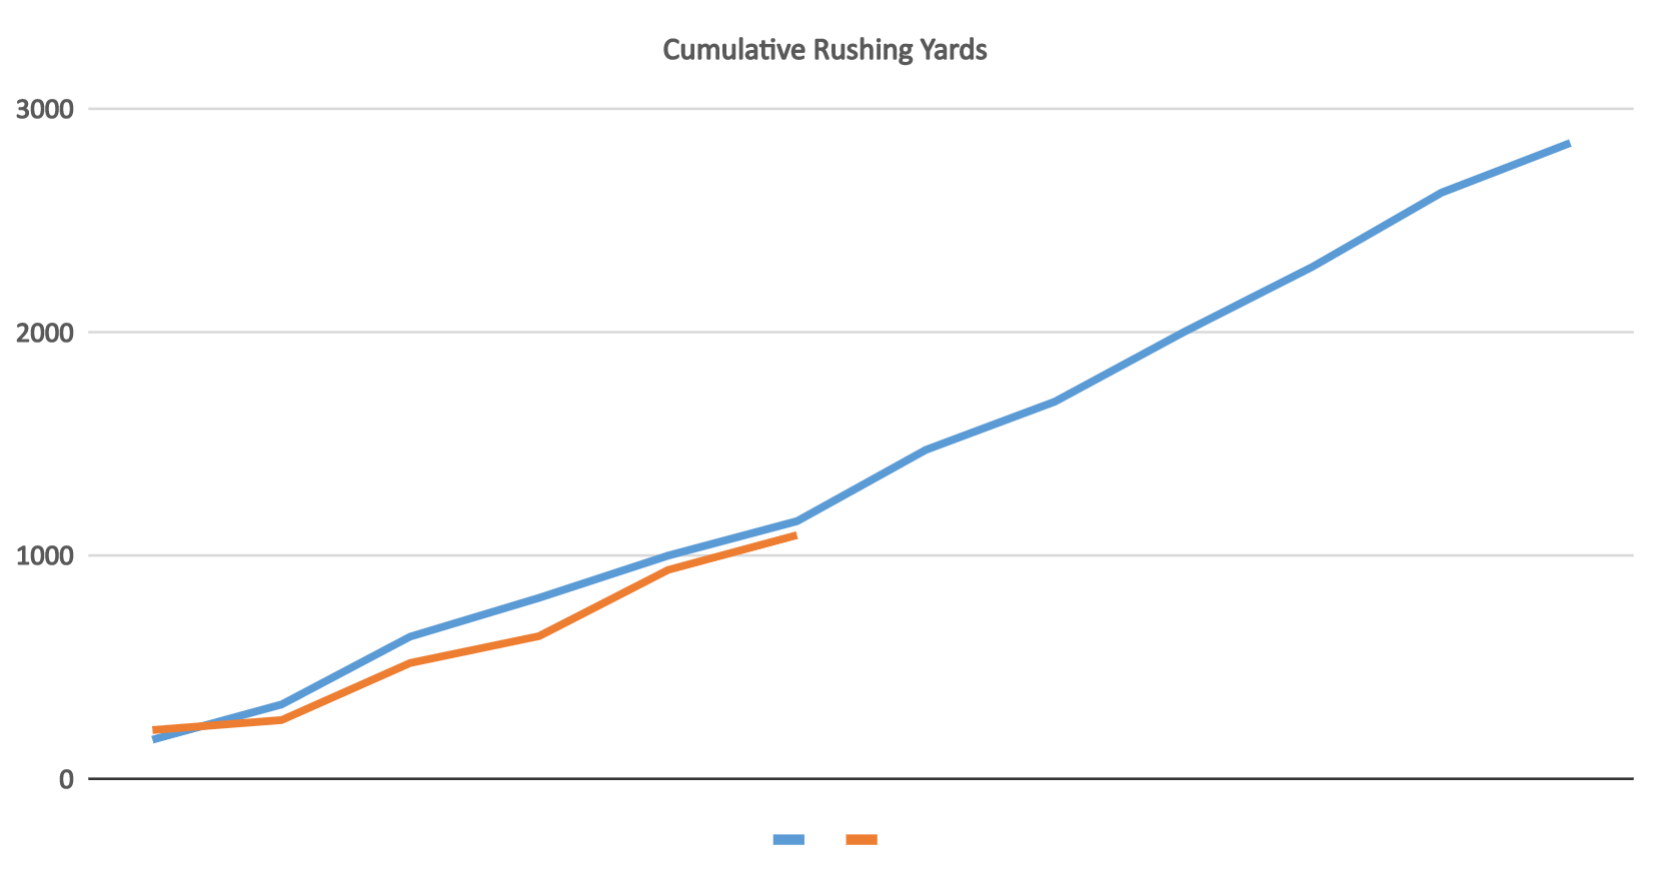
That’s … beathtaking.
Chuba actually gained a bit on Barry here in Game 6 as Barry had 154 against Mizzou and Chuba had 156 against Texas Tech. Howevah! Barry put up 215 or more in every game after that in 1988, including 320 (!) against Kansas State in Game 7. If Chuba tosses 320 on Baylor next weekend, I’m going to need an oxygen mask.
“I may be way out of my line — I hate making comparisons — but he kind of reminds me of Le’Veon Bell-ish,” Brandon Weeden said this week on our podcast. “He’s bigger, taller, pretty thick. Kind of has the same running style, has breakaway speed. He’s extremely patient. He lets things develop and then he hits it. He’s always, always falling forward, that’s the sign of a good back.
“I’ve been really impressed. The numbers speak for themselves, but some of these runs he’s making when things really aren’t blocked that well and he’s getting 7 or 8 yards — they’re kind of hidden yards, not going to be on SportsCenter — but you’re like ‘Damn, that’s pretty impressive.'”
Chuba’s not just chasing ghosts either. He’s still distancing himself from others in the 2019 race for preeminent national rusher. Incredibly, only nine players have hit the 600-yard mark, and Chuba has nearly 1,100. He’s more than doubled the production of all but 15 other runners nationally.
Here’s a look at some of the data.
Yards/Game
| Name | Team | Yards/Game |
|---|---|---|
| Chuba Hubbard | Okla St | 182.3 |
| Jonathan Taylor | Wisconsin | 149 |
| J.K. Dobbins | Ohio State | 137.7 |
| Bryant Koback | Toledo | 125.6 |
| AJ Dillon | BC | 124.2 |
| Kenneth Gainwell | Memphis | 124 |
| Tre Siggers | N Texas | 120 |
Total TDs
| Name | Team | TD |
|---|---|---|
| Chuba Hubbard | Okla St | 13 |
| Jonathan Taylor | Wisconsin | 12 |
| Xavier Jones | SMU | 12 |
| Darrynton Evans | App St | 9 |
| Malcolm Perry | Navy | 9 |
| Elijah Mitchell | La-Lafytte | 9 |
| LeVante Bellamy | W Mich | 8 |
| Justin Fields | Ohio State | 8 |
| Cam Akers | FSU | 7 |
| Jalen Hurts | Oklahoma | 7 |
| JaTarvious Whitlow | Auburn | 7 |
| Anthony McFarland Jr. | Maryland | 7 |
Total Yards
| Name | Team | Yards |
|---|---|---|
| Chuba Hubbard | Okla St | 1094 |
| J.K. Dobbins | Ohio State | 826 |
| Jonathan Taylor | Wisconsin | 745 |
| AJ Dillon | BC | 745 |
| Xavier Jones | SMU | 646 |
| LeVante Bellamy | W Mich | 629 |
| Bryant Koback | Toledo | 628 |
| Kenneth Gainwell | Memphis | 620 |
| Marvin Kinsey Jr. | CSU | 618 |
Even though I’ve been staring at them week after week, the numbers don’t become less astonishing. Jonathan Taylor hasn’t cracked the 150/game mark yet, and Chuba’s flirting with 200! He’s more than doubled J.K. Dobbins’ TDs. He has nearly 2.5x as many yards as preseason Heisman candidate Travis Etienne of Clemson.
We could do this all day.
My hope in this, I suppose, is that the current numbers and the snaking Sanders graph serve to remind all of us that even at a place that’s seen an embarrassing number of elite running backs, it’s rare that one comes along that’s as special as 30.


Oklahoma State Wins All-Sports Bedlam for Sixth Time in Last Seven Years

Report: Kashie Natt Files Lawsuit Against NCAA Seeking Eligibility

Viktor Hovland Outlasts Scottie Scheffler to Win Traveler’s Championship

Fixing the Group of Five: A Fun Idea to Bring Promotion-Relegation to College Football

2025–26 Oklahoma State Final Grades: Cowboy Golf, Track End the Year on High Notes

Texas Tech, Colorado Headline Big 12’s Top Defensive Portal Additions This Offseason

The Reload Ep. 53: World Cup Grass, Big 12 Media Days Preview

Daily Bullets (July 3): The All-Portal Pokes

Oklahoma State’s Offense Well Represented on Big 12 All-Portal Team

Marcus Smart Signs with Houston Rockets
-
 Baseball4 days ago
Oklahoma State Wins All-Sports Bedlam for Sixth Time in Last Seven Years
-
 Hoops4 days ago
Report: Kashie Natt Files Lawsuit Against NCAA Seeking Eligibility
-
 Golf4 days ago
Viktor Hovland Outlasts Scottie Scheffler to Win Traveler’s Championship
-
 Football4 days ago
Fixing the Group of Five: A Fun Idea to Bring Promotion-Relegation to College Football