
Hoops
Jeffrey Carroll Went From Inconsistent Bench Threat To All Big-12
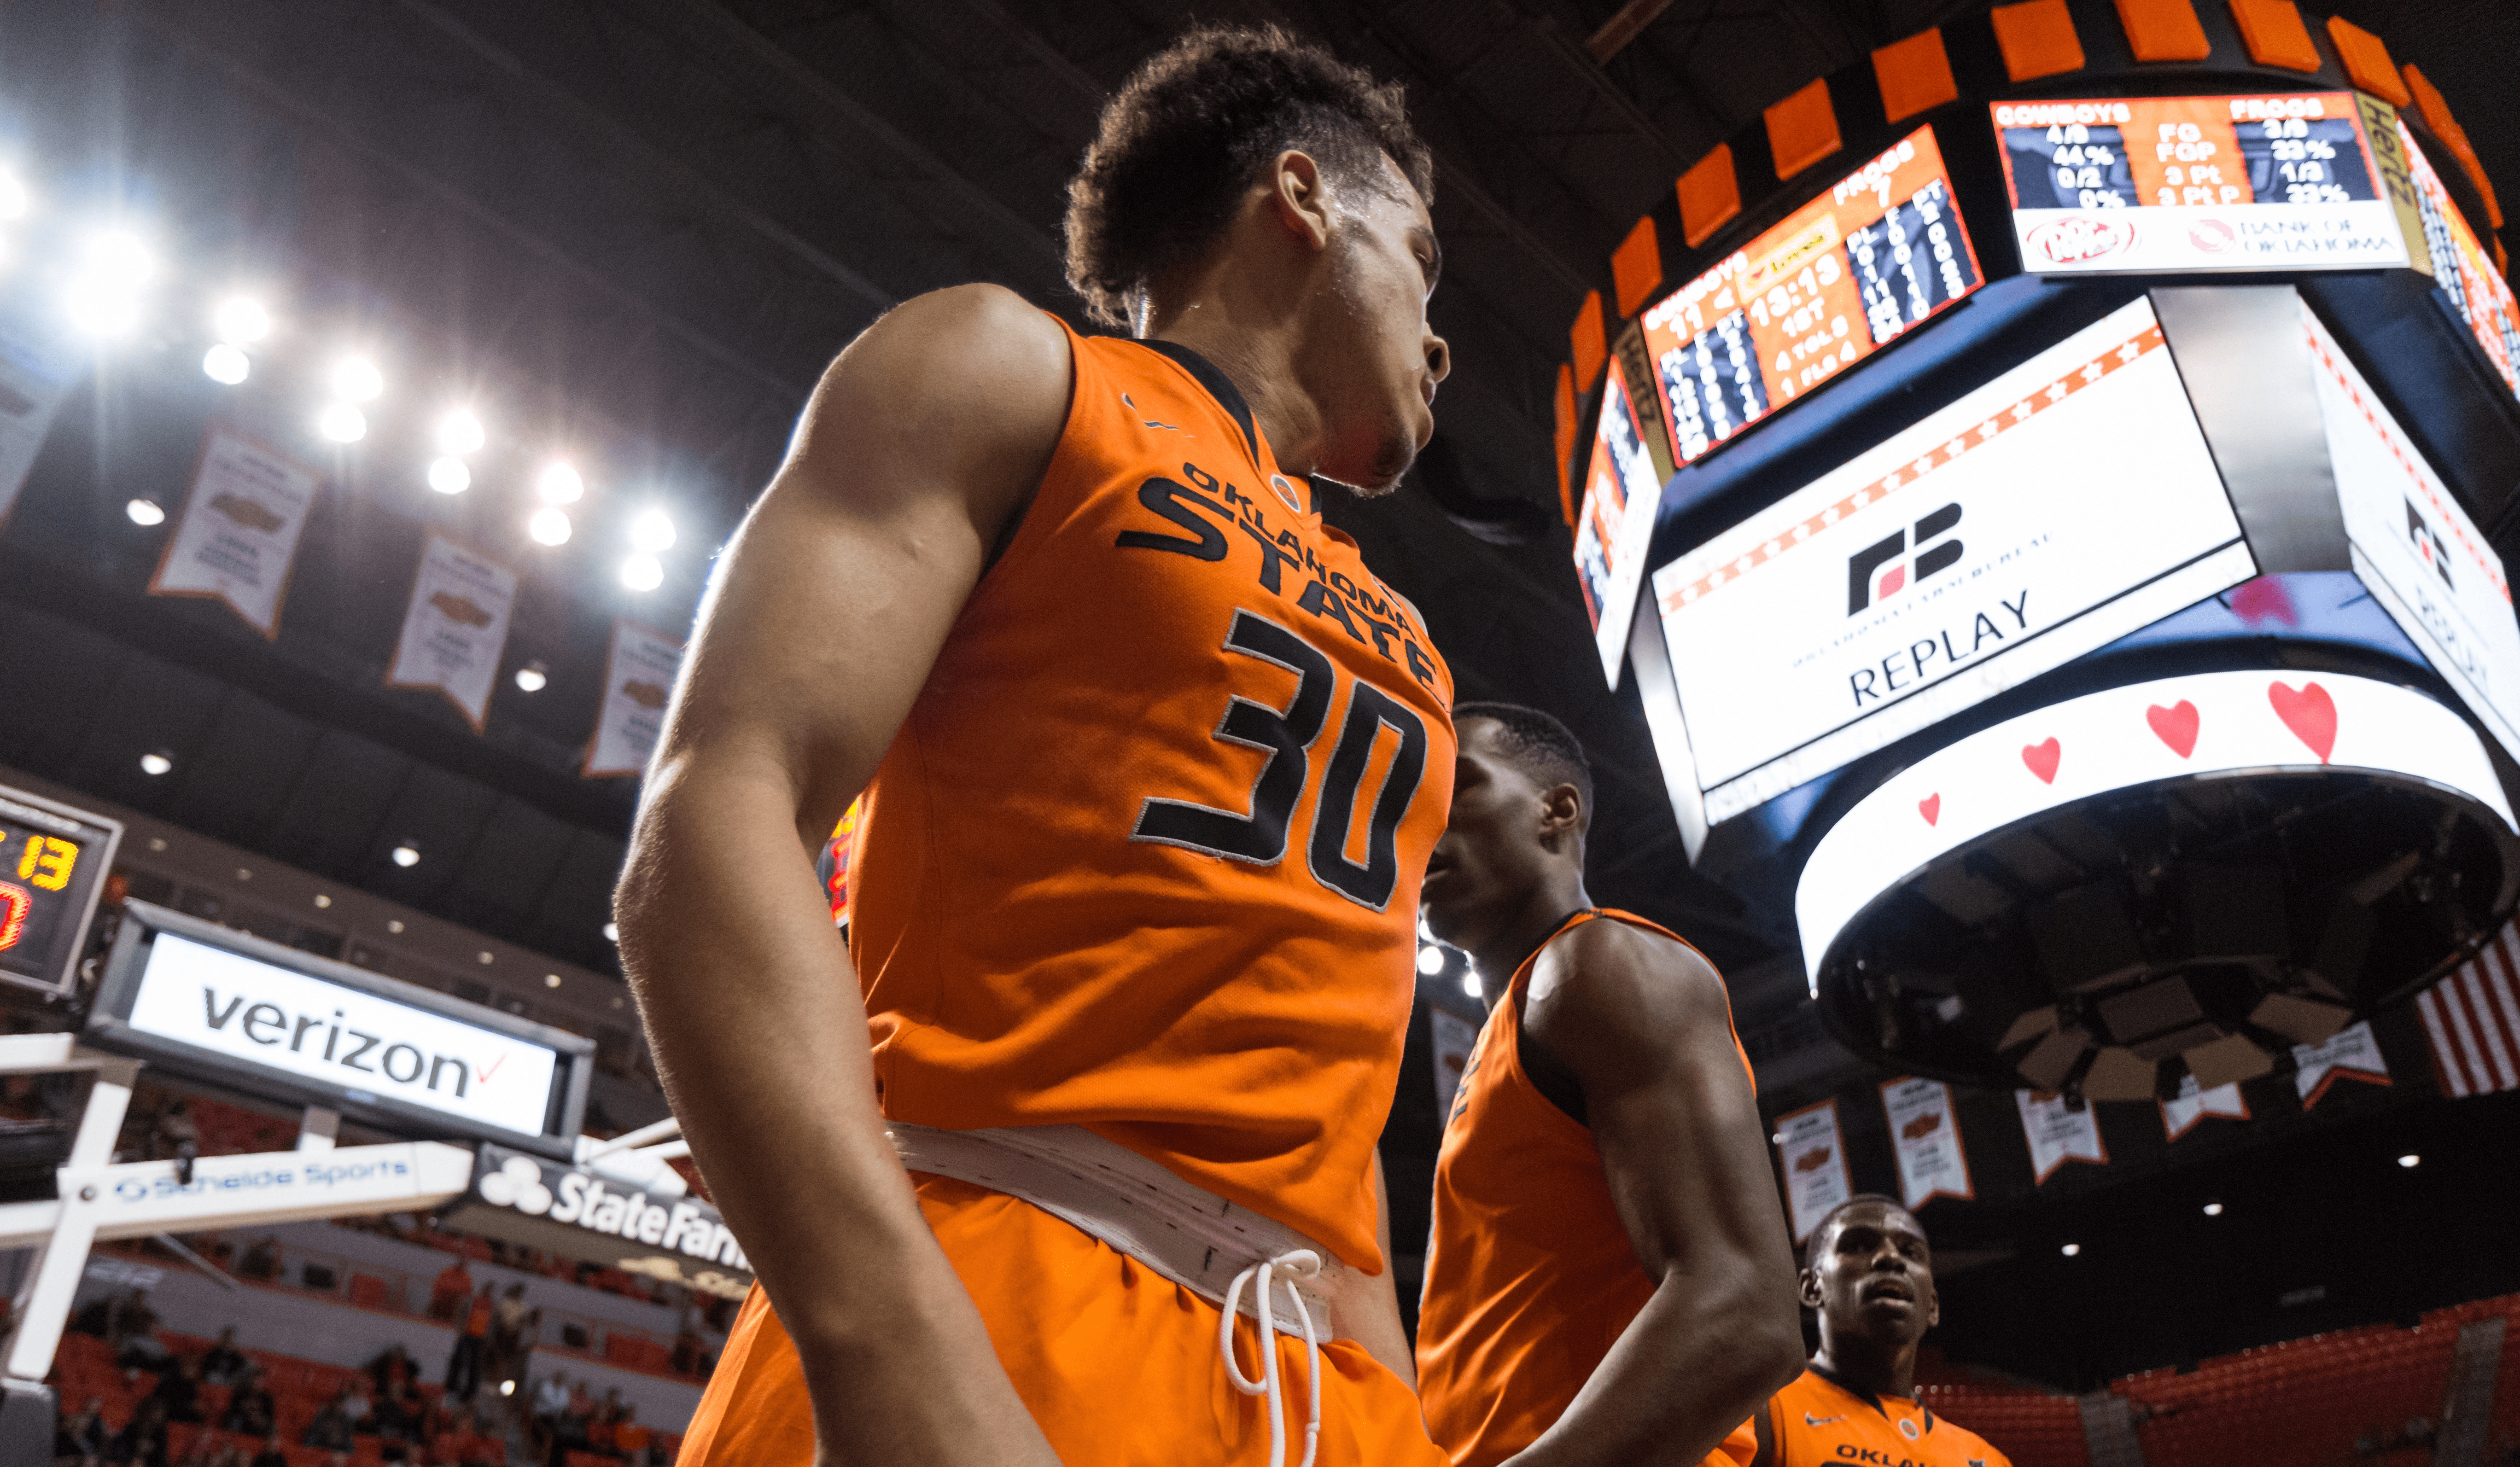
It’s been written before on this site, and it will be written again, but the fact remains — Jeff Carroll is balling out in his junior season in Stillwater. Just one year removed from averaging a little over 8 points a game and 4 rebounds a game on 41 percent shooting, Clip has taken a massive leap forward in year one of the Brad Underwood era of Oklahoma State basketball.
Carroll is sitting at 17.7 points per game, 7.3 rebounds per game, and shooting 50 percent from 3-point range. Carroll is a top give player in KenPom’s offensive efficiency rating among players used in at least 20 percent of their teams offensive possessions, just behind Duke’s Luke Kennard and ahead of the likes of UCLA’s Lonzo Ball and TJ Leaf, Villanova’s Josh Hart, and Kansas’ Frank Mason.
| Rank | Player | Team | Yr | ORating (usage) |
|---|---|---|---|---|
| 1 | Lauri Markkanen | Arizona | Fr | 137.4 (20.9) |
| 2 | Eric Garcia | Wofford | Sr | 135.0 (20.6) |
| 3 | Luke Kennard | Duke | So | 132.7 (22.0) |
| 4 | Jeffrey Carroll | Oklahoma St. | Jr | 132.4 (23.1) |
| 5 | Andrew Rowsey | Marquette | Jr | 131.7 (20.2) |
| 6 | Vladimir Brodziansky | TCU | Jr | 131.6 (23.2) |
| 7 | Dexter Werner | North Dakota St. | Sr | 131.5 (21.6) |
| 8 | TJ Leaf | UCLA | Fr | 130.4 (20.5) |
| 9 | Lonzo Ball | UCLA | Fr | 129.8 (20.2) |
| 10 | Josh Hart | Villanova | Sr | 129.8 (26.6) |
This stat (offensive efficiency) equals how many points a player scores per 100 possessions, and Clip’s number is a ridiculous 132.4 (132 points scored per 100 offensive possessions he participates in).
When ya boy asks the prettiest girl in school to the Homecoming dance in front of the whole student body at lunch and she says yes. pic.twitter.com/gsFSvfRPni
— Pistols Firing (@pistolsguy) January 24, 2017
So it’s only right that we start talking about Clip as a potential all Big-12 player, right?
Jeffrey Carroll continues to be awesome. pic.twitter.com/YRpZbtam6t
— Pistols Firing (@pistolsguy) December 22, 2016
Carroll leads the Big 12 among those playing in at least 20 percent of their team’s offensive possessions with that stupid 132.4 offensive efficiency. To go along with this he has a Big-12 leading 66.7 percent effective shooting percentage, which takes into account shooting percentages for both 2s and also 3-pointers counting for more.
Need any more proof?
- 17.7 points per game (3rd in Big 12)
- 7.3 rebounds per game (tied for 5th in Big 12)
- 132.4 offensive efficiency (1st in Big 12)
- 67% effective shooting percentage (1st in Big 12)
- 50% 3-point shooting percentage (2nd in Big 12)
Wow!
Let’s take a look since 2010 in regards to a couple stats: points per game, rebounds per game, and that effective field goal percentage.
| Player | Season | Team | Points | Reb | eFG% |
|---|---|---|---|---|---|
| Damion James | 2010 | Texas | 18.0 | 10.3 | 54% |
| James Anderson | 2010 | Oklahoma State | 22.3 | 5.8 | 53% |
| Marcus Morris | 2011 | Kansas | 17.2 | 7.6 | 60% |
| Jordan Hamilton | 2011 | Texas | 18.6 | 7.7 | 52% |
| Alec Burks | 2011 | Colorado | 20.5 | 6.5 | 50% |
| Royce White | 2012 | Iowa State | 13.4 | 9.3 | 54% |
| Ben McLemore | 2013 | Kansas | 15.9 | 5.2 | 59% |
| Melvin Ejim | 2014 | Iowa State | 17.8 | 8.4 | 56% |
| Georges Niang | 2014 | Iowa State | 16.7 | 4.5 | 53% |
| Georges Niang | 2015 | Iowa State | 15.3 | 5.4 | 52% |
| Perry Ellis | 2015 | Kansas | 13.8 | 6.9 | 48% |
| Perry Ellis | 2016 | Kansas | 16.9 | 7.8 | 57% |
| Georges Niang | 2016 | Iowa State | 20.5 | 6.2 | 60% |
| Taurean Prince | 2016 | Baylor | 15.9 | 6.1 | 49% |
| Jeffrey Carroll | 2017 | Oklahoma State | 17.7 | 7.3 | 67% |
Clip can hang!
Among the 15 listed above, Carroll ranks 7th on the list in points per game, 7th in rebounds, and 1st in effective field goal percentage. He definitely belongs on the 1st team this year in terms of sheer numbers. Of course, most of these guys were on better overall teams. If OSU can close strong, though, Carroll should make it.
But even if star sophomore Jawun Evans declares for the draft after this season, Oklahoma State will (hopefully) return at least one All-Big 12 star for 2017-2018 to build around.


Roundtable Mailbag: Position Group Power Rankings, Will Mestemaker Be a First Round Pick?

Oklahoma State Lands Three-Star 2027 OL Jake Baker

Daily Bullets (June 15): Pokes Add Southeastern Lineman, Eric Morris Among Peers

Three-Star Safety Chayce Davis Commits to Oklahoma State

OSU Baseball: Morehead State Transfer Aubrey Kearns Commits to Cowboys

Oklahoma State Quarterback Drew Mestemaker to Attend Manning Passing Academy

Former OSU Offensive Line Commit Chase Clark Flips to Purdue

Cowboy Hoops: Oklahoma State to Host Saint Mary’s This Season

The Reload Ep. 51: Mailbag Episode, Discussing Sorsby, the Future of Diamond Sports and More

Daily Bullets (June 18): Pokes Add Pitching
-
 Football4 days ago
Roundtable Mailbag: Position Group Power Rankings, Will Mestemaker Be a First Round Pick?
-
 Football4 days ago
Oklahoma State Lands Three-Star 2027 OL Jake Baker
-
 Daily Bullets4 days ago
Daily Bullets (June 15): Pokes Add Southeastern Lineman, Eric Morris Among Peers
-
 Football3 days ago
Three-Star Safety Chayce Davis Commits to Oklahoma State