
Football
Kansas State Had Its Way with Oklahoma State’s Defense on Saturday
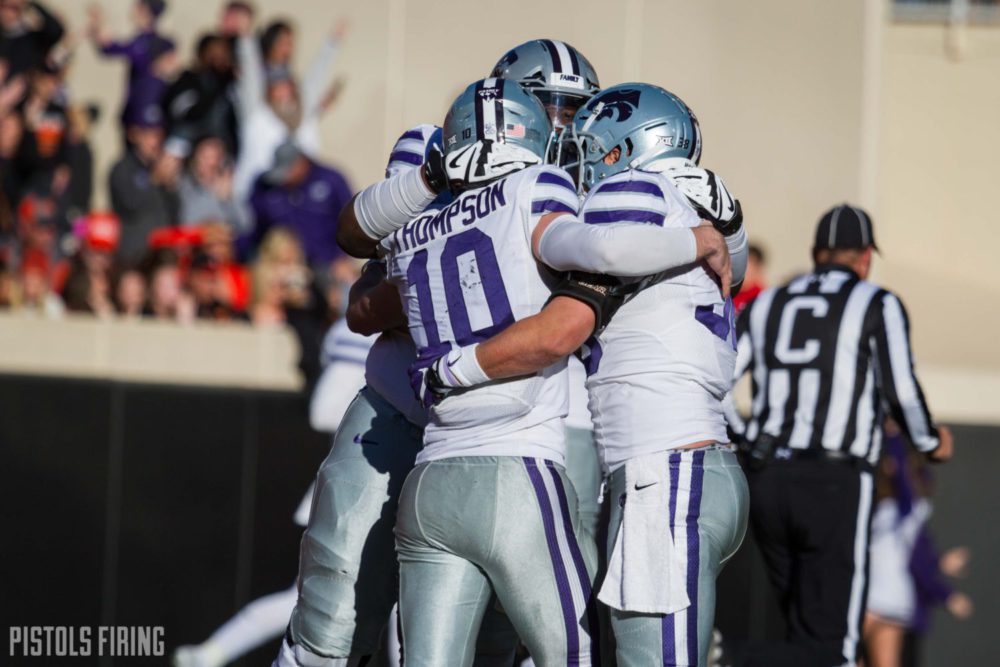
The Cowboys took an L on their home field for the third time this season and it might be one of the worst losses in the Mike Gundy era. A team with playoff hopes prior to the season and Big 12 title aspirations as recently as this afternoon, succumbed to a 5-5 opponent which hadn’t won a game in Stillwater since people were still worried about Y2K.
The Cowboys offense struggled for big chunks of the game — going 29:56 worth a game time between touchdowns — but OSU’s defense didn’t do the Pokes any favors either, giving up oodles of yards and points to a three-score underdog.
A defense whose praises I was singing (and so were some of you) after back-to-back solid outings against Texas and West Virginia, gave up numbers well above the Wildcats’ season average — with a third-string quarterback.
Let’s take a look.
| K-State Offensive Stats | Season Average | Against Oklahoma State |
|---|---|---|
| Scoring Offense | 32.0 | 45 |
| Yards Per Play | 6.1 | 6.8 |
| Passing Offense | 182.1 | 204 |
| Total Pass TDs/INTs | 10/7 | 3/0 |
| Yards Per Completion | 15.2 | 20.4 |
| Combined Pass Rating | 133.9 | 284.9 |
| Rushing Offense | 191.4 | 217 |
| Yards Per Carry | 4.9 | 4.4 |
| 3rd Down Conversion | 31.6% | 25.0% |
This will likely go down as one of the worst losses during Mike Gundy’s tenure. And with just a senior night game against Kansas on the horizon and whatever bowl game the Cowboys draw, there isn’t an optimistic spin you can easily fit on it.
There’s plenty of blame to go around but for huge chunks of this game, OSU’s defense allowed a sub-par offense with its third QB to run up and down the field at will. There’s definitely not a positive spin for that.
It goes deeper than that. According to our PF Defense stat, three of Oklahoma State’s four worst defensive performances have come in the last three weeks. This stat takes your opponent’s PPD number (for Kansas State, it is 2.15) and creates an expected number of points you should give up based on how many drives you face.
For OSU on Saturday, that was 32.13 because KSU had 15 drives of more than zero plays (we don’t count the kick return). The Pokes gave up just over the expected value, but again, KSU wasn’t really trying to score on its last 3-4 drives.
Here are the defensive performances for OSU ranked from first to worst in the Big 12 this year.
| Game | Avg. PPD | Drives vs. OSU | Expected | Actual | Difference |
|---|---|---|---|---|---|
| TCU | 1.99 | 13 | 25.9 | 44 | 18.1 |
| Iowa State | 2.00 | 14 | 28.0 | 42 | 14.0 |
| Oklahoma | 3.41 | 15 | 51.1 | 62 | 10.9 |
| Kansas State | 2.15 | 15 | 32.3 | 38 | 5.8 |
| Texas Tech | 2.47 | 12 | 29.6 | 27 | -2.6 |
| Baylor | 1.94 | 14 | 27.1 | 16 | -11.1 |
| West Virginia | 2.35 | 16 | 37.6 | 24 | -13.6 |
| Texas | 1.63 | 15 | 24.5 | 10 | -14.5 |


Four-Star In-State Target Israel Hammons to Announce College Decision Friday

Three-Star Safety Chayce Davis Commits to Oklahoma State

Update: Sorsby Reportedly Entering NFL Supplemental Draft

Oklahoma State a Finalist for Offensive Line Prospect Tristan Hardin-Roberts

U.S. Open Preview: The Cowboys Will Be Well Represented at Shinnecock Hills

OSU Baseball: Cowboys Land Washington Pitcher Noah Kenney, Texas Tech Transfer Will Jordan

Wyatt Hendrickson Makes United States World Team

Daily Bullets (June 20): Eric Morris Reels in a Four-Star, Doug Gottlieb Extended

WATCH: Eric Morris Puts Three Oklahoma State Walk-Ons On Scholarship

Four-Star Linebacker Israel Hammons Commits to Oklahoma State
-
 Football3 days ago
Four-Star In-State Target Israel Hammons to Announce College Decision Friday
-
 Football4 days ago
Three-Star Safety Chayce Davis Commits to Oklahoma State
-
 Football5 days ago
Update: Sorsby Reportedly Entering NFL Supplemental Draft
-
 Football4 days ago
Oklahoma State a Finalist for Offensive Line Prospect Tristan Hardin-Roberts