
Football
Oklahoma State No. 37 in Athletic Department Revenue
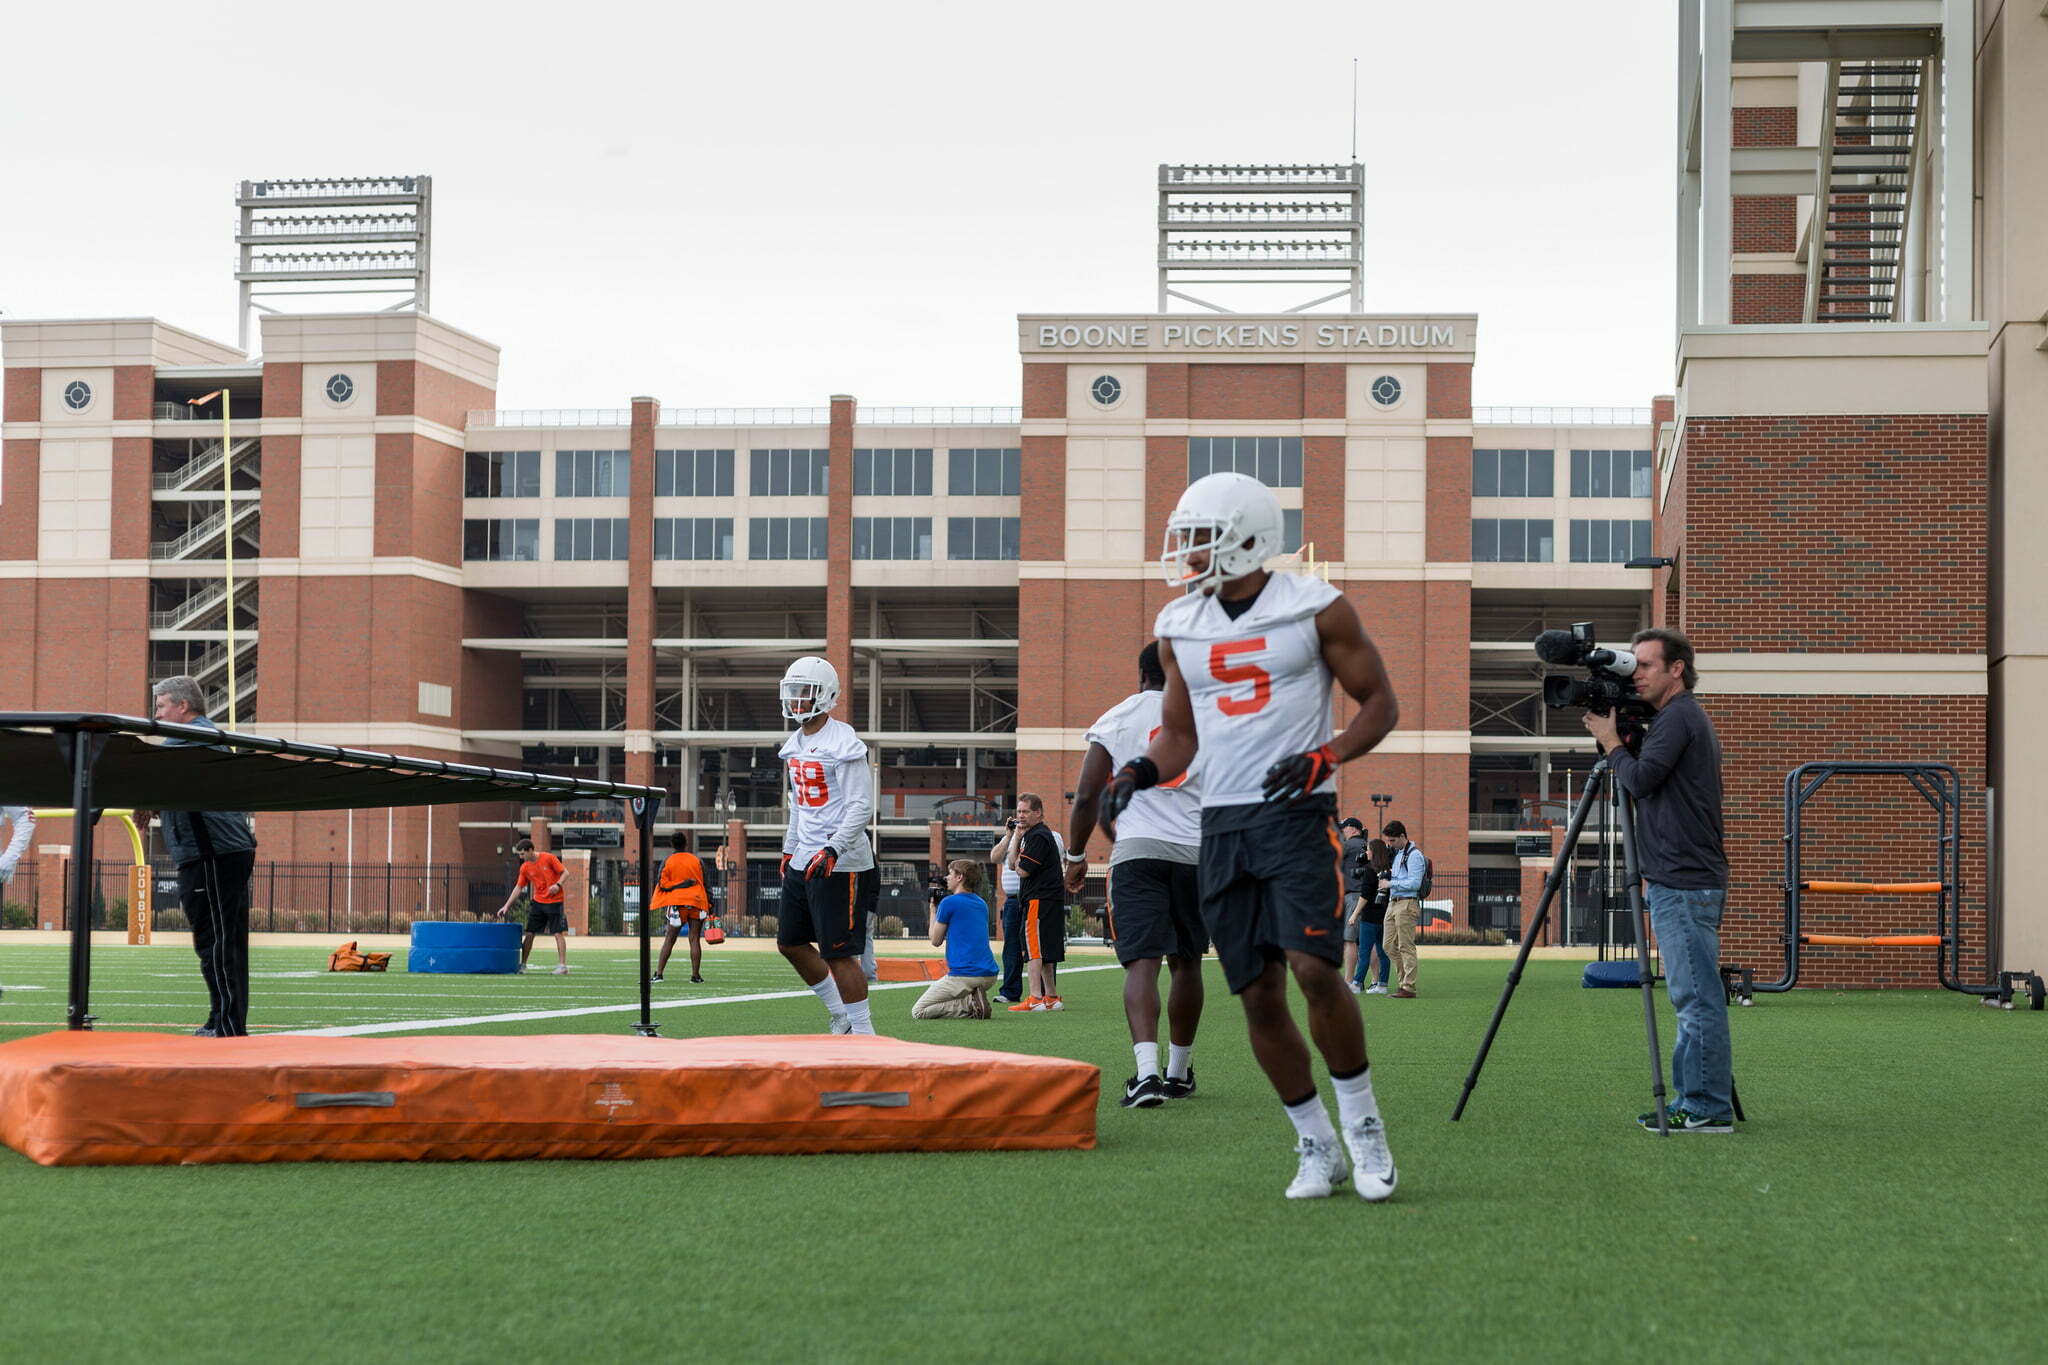
The new athletic department revenue numbers are out for the past year, and Oklahoma State checked in at No. 37 in the rankings having hauled in $93.7 million. That’s about $2.3 million less than the previous year when OSU finished No. 26.
The Cowboys come in just behind North Carolina, Mississippi State, Maryland and Arizona State and just ahead of Kansas, Arizona, Rutgers and Virginia Tech.
| Rank | School | Conference | Revenue | Expenses |
|---|---|---|---|---|
| 30 | Missouri | SEC | $97,275,839 | $94,323,693 |
| 31 | Illinois | Big Ten | $96,249,500 | $102,912,910 |
| 32 | Indiana | Big Ten | $95,216,762 | $94,190,256 |
| 33 | North Carolina | ACC | $95,175,985 | $95,175,985 |
| 34 | Mississippi State | SEC | $94,903,405 | $84,732,091 |
| 35 | Arizona State | Pac-12 | $94,662,743 | $89,086,777 |
| 36 | Maryland | Big Ten | $94,101,697 | $94,101,697 |
| 37 | Oklahoma State | Big 12 | $93,672,676 | $92,926,534 |
| 38 | Kansas | Big 12 | $90,658,829 | $85,703,264 |
| 39 | Arizona | Pac-12 | $85,356,236 | $87,254,614 |
| 40 | Rutgers | Big Ten | $83,974,159 | $83,974,159 |
Texas A&M finished No. 1 for the second year in a row and brought in $194.4 million. Oklahoma State finished No. 4 in the Big 12 (TCU and Baylor do not have to report their numbers — or, apparently, anything else that happens at their campuses).
| Overall Rank | School | Conference | Revenue | Expenses |
|---|---|---|---|---|
| 2 | Texas | Big 12 | $187,981,158 | $171,394,287 |
| 6 | Oklahoma | Big 12 | $150,373,216 | $127,268,340 |
| 26 | West Virginia | Big 12 | $105,140,368 | $85,900,652 |
| 37 | Oklahoma State | Big 12 | $93,672,676 | $92,926,534 |
| 38 | Kansas | Big 12 | $90,658,829 | $85,703,264 |
| 42 | Texas Tech | Big 12 | $82,996,321 | $78,598,577 |
| 48 | Iowa State | Big 12 | $78,355,500 | $78,279,309 |
| 49 | Kansas State | Big 12 | $77,936,664 | $70,884,496 |
For fun I looked at revenue per win over the last two years for Power 5 schools. So I took 2015-2016 football wins totals and divided the most recent revenue numbers by that total.
| Rank | Team | Wins | Revenue | Revenue/win |
|---|---|---|---|---|
| 1 | Washington State | 17 | $58,753,266 | $3,456,074 |
| 2 | Clemson | 28 | $104,823,057 | $3,743,681 |
| 3 | Utah | 19 | $79,447,512 | $4,181,448 |
| 4 | Oklahoma State | 20 | $93,672,676 | $4,683,634 |
| 5 | Virginia Tech | 17 | $83,702,698 | $4,923,688 |
| 6 | North Carolina | 19 | $95,175,985 | $5,009,262 |
| 7 | Kansas State | 15 | $77,936,664 | $5,195,778 |
| 8 | Colorado | 14 | $77,276,889 | $5,519,778 |
| 9 | Washington | 19 | $107,154,560 | $5,639,714 |
| 10 | Iowa | 20 | $113,249,020 | $5,662,451 |
I’m not totally sure what this tells us, but I thought it was interesting. The teams you’d expect to be at the top are at the top. Alabama is $5.9M per win which is incredible given that they bring in $164 million. Texas is $18.8M. Sad!
I don’t know if this means OSU is doing great for netting a lot of wins with not a ton of money or if it shows how they’re not capitalizing on their success properly. Either way, they’re the only Power 5 school with an operating budget under $100 million to win 20+ games in the last two seasons. Long live the mullet.


Cowboys Aim to Shrink Gap with Oregon, Ride Positive Offseason Momentum into Fall Camp

OSU Baseball: Kollin Ritchie Announces Return Following MLB Draft Selection

OSU Baseball: Four Cowboys Drafted on Day 2 of MLB Draft

What Is It like Tackling Caleb Hawkins, Big 12 Will Soon Find Out

Daily Bullets (July 11): Coach Mike Earns (Another) Big Break

Daily Bullets (July 15): Another MLB All-Star, Mestemaker the Next Star?

Eric Morris Expects ‘Breakout Season’ for Oklahoma State’s ‘Most Disruptive’ Defender Jaleel Johnson

OSU Baseball: Aidan Meola Signs Free Agent Deal with Colorado Rockies

Daily Bullets (July 14): PFF Loves Caleb Hawkins, Vegas Warming to Cowboys

To Take Shots or Not to Take Shots: Morris, Mestemaker Know When to Be Aggressive and When to Let the Game Come to Them
-
 Football2 days ago
Cowboys Aim to Shrink Gap with Oregon, Ride Positive Offseason Momentum into Fall Camp
-
 Baseball3 days ago
OSU Baseball: Kollin Ritchie Announces Return Following MLB Draft Selection
-
 Baseball3 days ago
OSU Baseball: Four Cowboys Drafted on Day 2 of MLB Draft
-
 Football2 days ago
What Is It like Tackling Caleb Hawkins, Big 12 Will Soon Find Out