
Football
Oklahoma State Thriving in PPD Through Two Weeks
I am one of only about six people in the state of Oklahoma who probably cares about this, but I’m here for the other five of you. I want to take a season-long look at Oklahoma State’s points per drive numbers and its stop rate (defined as number of drives an opposing team does not score divided by the number of total opposing drives).
Before the season started, we talked to Glenn Spencer about what statistics matter when it comes to his defense.
“We all want to set goals, we want to look at stats,” said Spencer. “The relevant stats are scoring defense (PPD), turnovers and red zone defense. Those are the three most relevant things that determine winning football games. My goal boards are less than 1.8.”
So where is Oklahoma State at thus far in terms of PPD?
Defense
I put together a chart showing how many points per drive Oklahoma State has allowed so far in 2017 after each game. So its yearly total was 1.21 after Game 1 and its yearly total after Game 2 was 0.92 — it should be encouraging that this is trending downward (although that is probably about to change).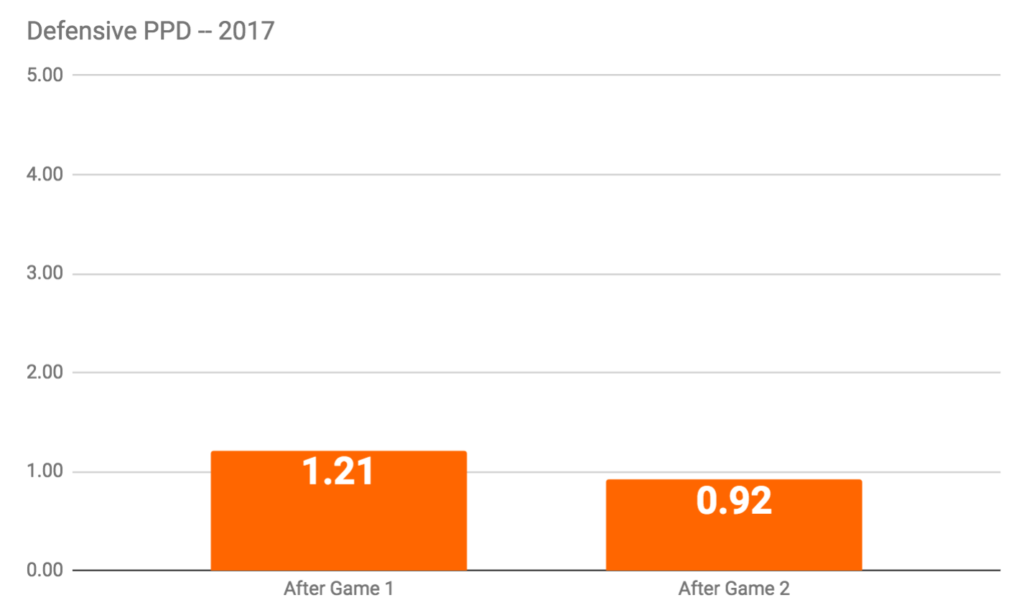
Interestingly, Oklahoma State has actually scored 0.5 points per drive on defense this year because of a pick-6 and a fumble recovery for a touchdown. So its net PPD is 0.42, which is insane. It should also be noted that OSU’s stop rate is 85 percent which means that on 17 of 20 opponent drives, OSU holds them to zero points (which is the goal).
Now let’s look at the offense.
Offense
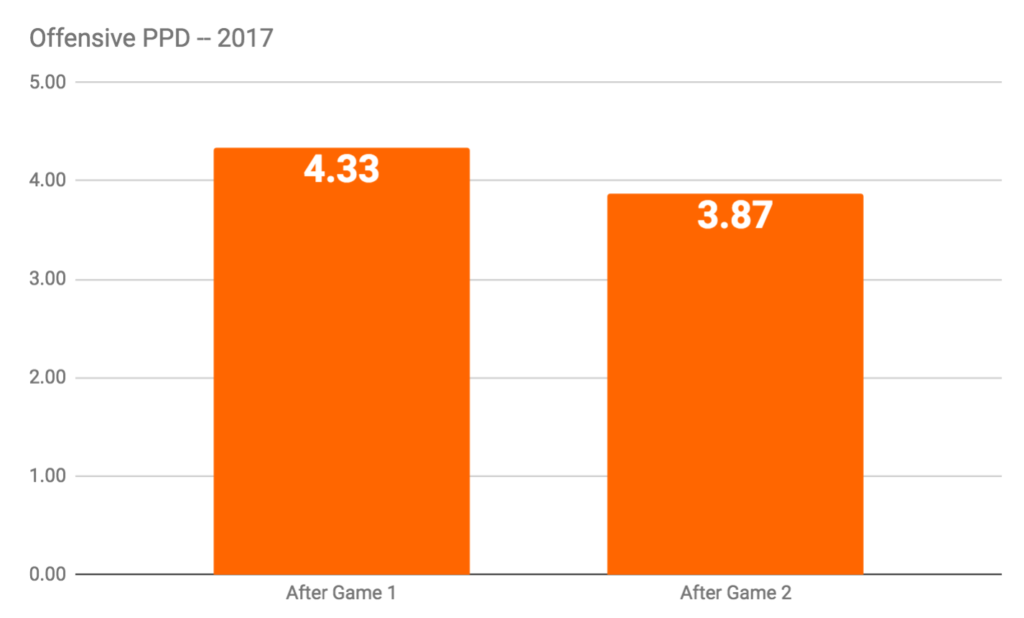
After a wicked good start against Tulsa, the numbers dropped a little bit against USA. As we’ll see in a minute, though, anything around 4.0 is historically great. This number is likely to drop as well as the Pokes start to face real defenses.
We don’t have any national numbers to compare this to yet, but in the weeks and months to come, those will be added in. What we do have is numbers from previous Oklahoma State seasons. Let’s look at those in comparison to this one.
Offense
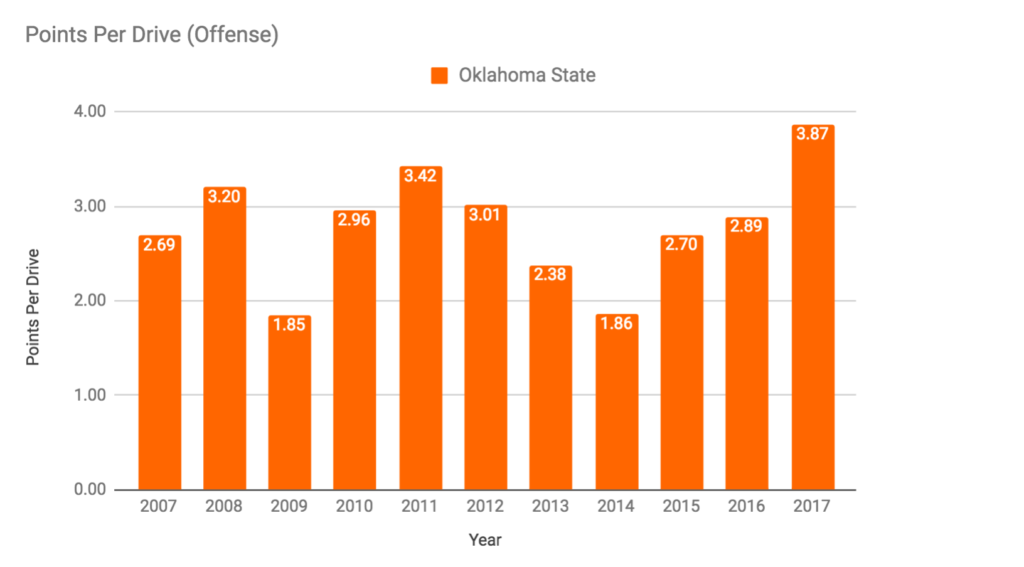
Again, it’s early in the year, but this pace for the OSU offense is even better than the famous 2011 O. They won’t keep it up (nobody really hovers around 4.0 PPD), but it’s still fun to look at right now.*
*It should be noted that if/when the PPD numbers come out on BCF Toys, they remove garbage time drives and non-FBS drives. That’s why our numbers will differ right now. I will switch to using their numbers whenever they are released.
Defense
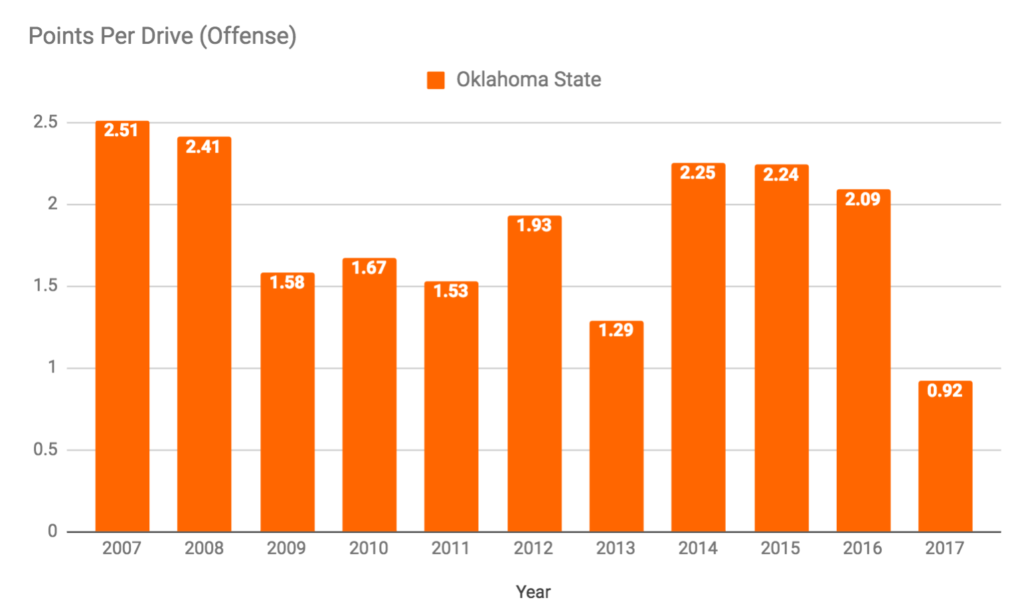
The crazy part to me is not the 0.92 number for OSU so far this year. The crazy part is that that 2013 team maintained a 1.29 number throughout. That’s something to shoot for, and I’m sure Glenn Spencer would be just fine with something resembling the 2009-2012 era.


Eric Morris’ Coaching Staff Has More in Common with Contenders than Big 12 Newcomers

Player Rating Superlatives: A Look at the Fastest, Strongest Cowboys in EA Sports’ College Football 27

Steve Lutz Releases Statement on Kashie Natt’s Eligibility Pursuit

Oklahoma State’s Offense Well Represented on Big 12 All-Portal Team

Daily Bullets (July 1): Caleb Hawkins a (Preseason) All-American

Daily Bullets (July 5): Some Predix for OSU Football

Daily Bullets (July 4): Can the Defense Match the Offense, Happy 250th, America!

Texas Tech, Colorado Headline Big 12’s Top Defensive Portal Additions This Offseason

The Reload Ep. 53: World Cup Grass, Big 12 Media Days Preview

Daily Bullets (July 3): The All-Portal Pokes
-
 Football4 days ago
Eric Morris’ Coaching Staff Has More in Common with Contenders than Big 12 Newcomers
-
 Football4 days ago
Player Rating Superlatives: A Look at the Fastest, Strongest Cowboys in EA Sports’ College Football 27
-
 Hoops4 days ago
Steve Lutz Releases Statement on Kashie Natt’s Eligibility Pursuit
-
 Football3 days ago
Oklahoma State’s Offense Well Represented on Big 12 All-Portal Team