
Football
Shhhhh … The 2017 Offense Might Be Better Than 2011
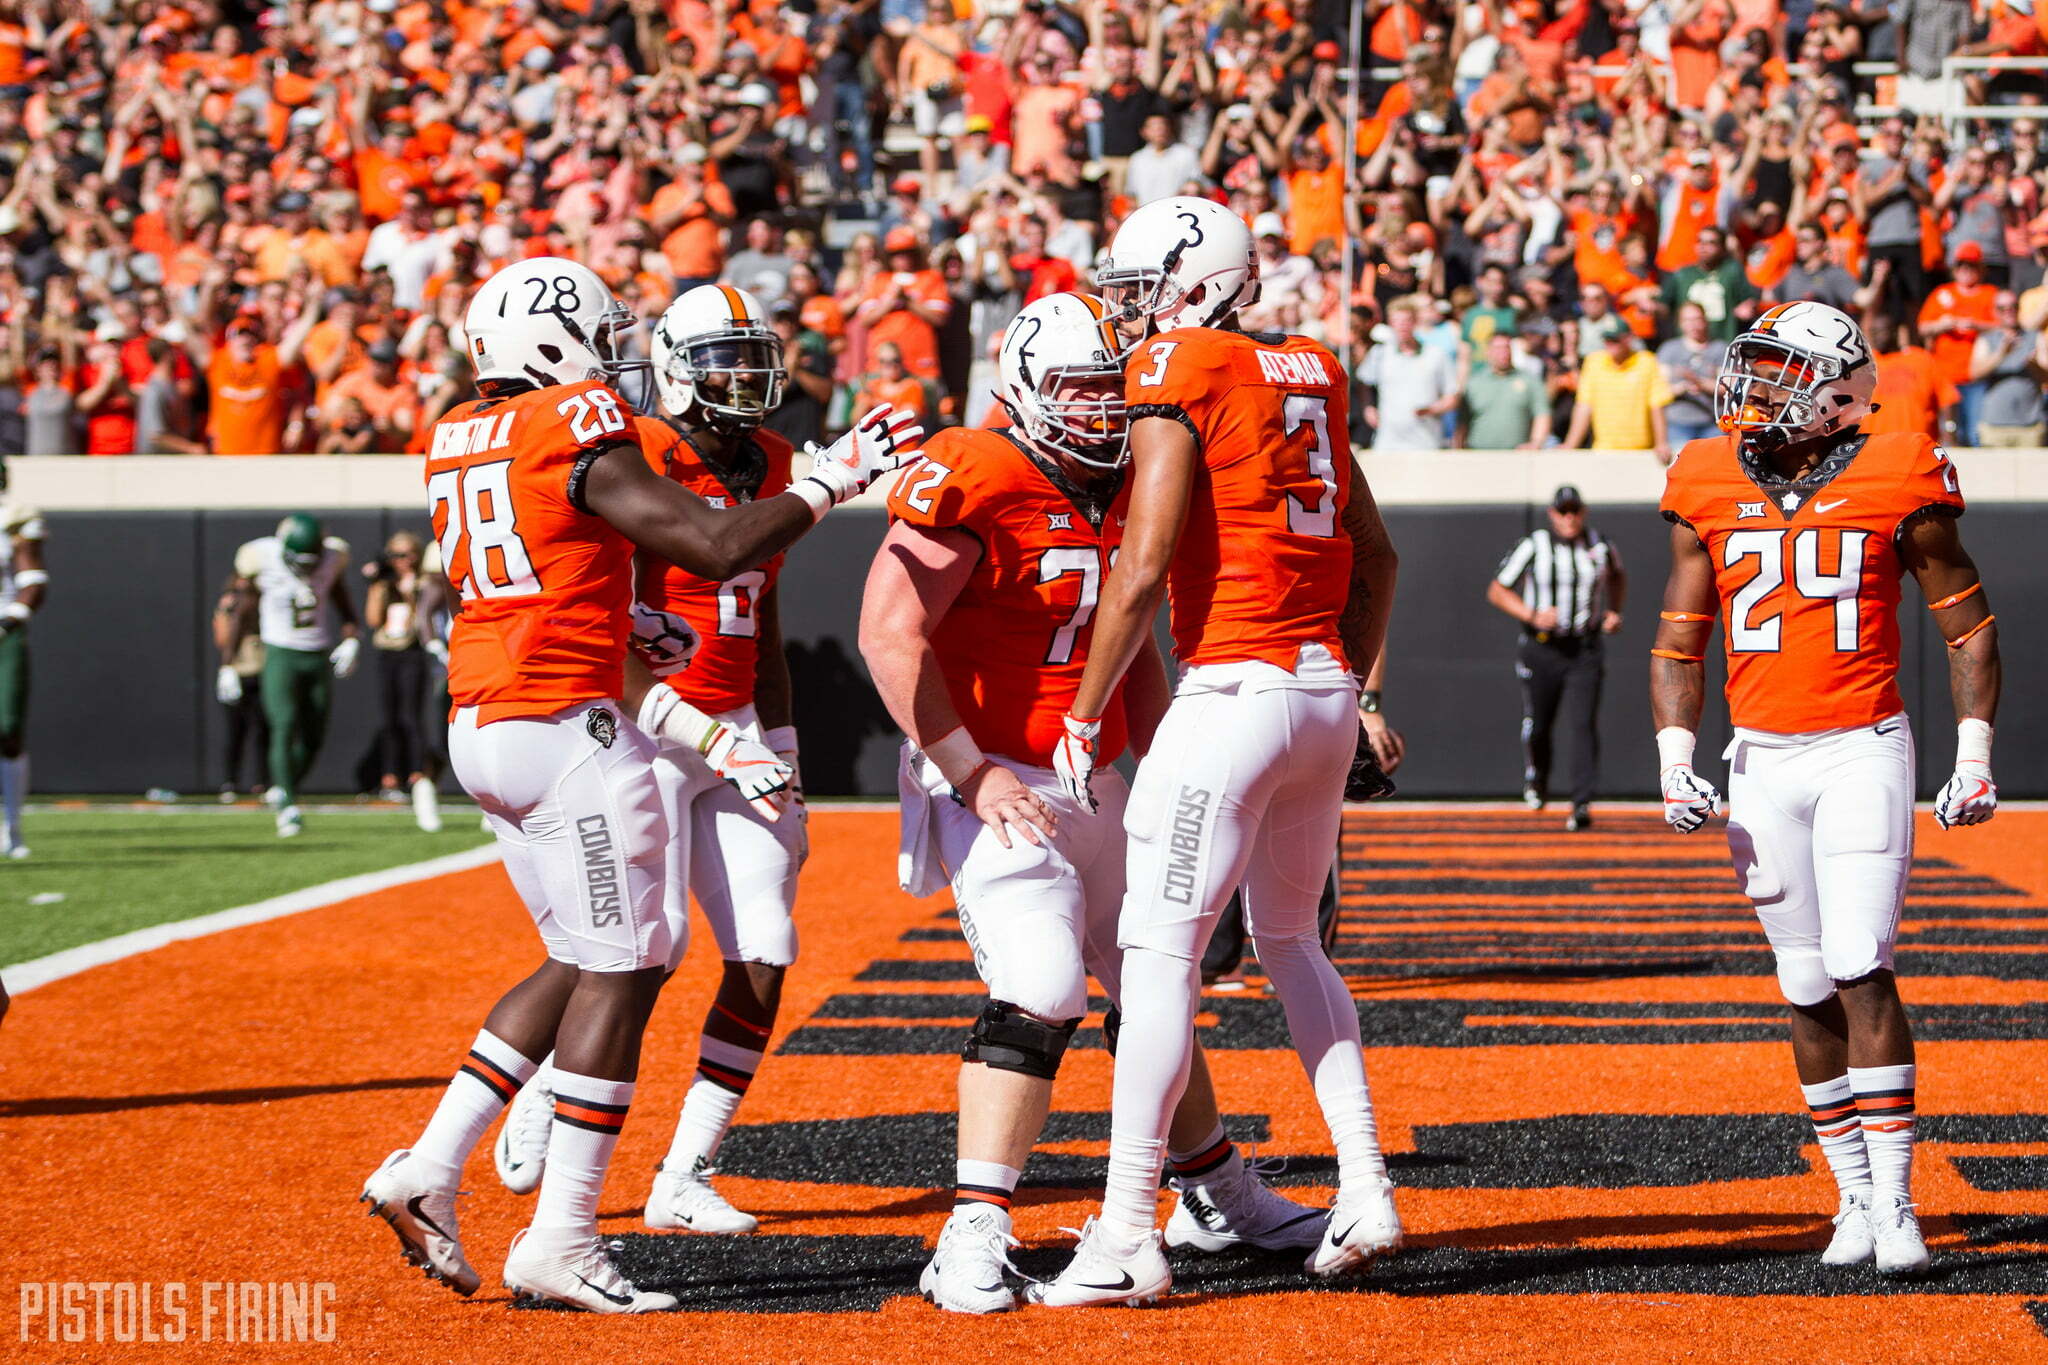
Well this is certainly a development. OSU has played half its schedule so far in 2017, and don’t look now (or do), but it is outpacing the dream 2011 offensive season by a pretty decent margin.
I guess this shouldn’t be a huge surprise considering it is coming off the most effective yardage day in school history and currently has the No. 1 offense in the country in yards per game, but it’s still shocking to see on paper.
Here’s how the two offenses match up through 24 quarters of football in their respective seasons.
| Thru Game 6 | 2011 Offense | 2017 Offense |
|---|---|---|
| Yards | 3,307 | 3,664 |
| Yards per play | 6.6 | 8.4 |
| Rush yards | 933 | 1,197 |
| Yards per carry | 4.4 | 5.4 |
| Pass yards | 2,374 | 2,467 |
| Yards per attempt | 8.3 | 11.4 |
| Points | 295 | 293 |
| Points per game | 49.2 | 48.8 |
| Offensive drives | 87 | 73 |
| Offensive points | 281 | 272 |
| Points per drive | 3.23 | 3.73 |
| First downs | 169 | 168 |
| Leading passer | Weeden — 350 YPG | Rudolph — 395 YPG |
| Leading rusher | Randle — 92 YPG | Hill — 106 YPG |
| Leading receiver | Blackmon — 101 YPG | Washington — 147 YPG |
The stunner for me is how many fewer drives the 2017 team has had than in 2011. That means you’re keeping the defense much fresher (by almost two drives a game!) while still scoring nearly as many offensive points.
Also, the yards per play thing is an eye-opener. Would you have guessed that Oklahoma State’s 2017 offense has been nearly two yards (!) better per play than in 2011? I wouldn’t have.
It’s pretty incredible. Again, I expect these two offenses to level out over the next six games. I think 2017 will slip a little, and 2011 certainly came on at the end. However, I know we remember that 2011 offense very fondly, or at least I do. Maybe too fondly. Because Mike & Mike are recreating in 2017 what Mike & Monk created in 2011, and …. shhh … they might be doing it even better (please don’t look at the TCU box score).


Oklahoma State Running Back Caleb Hawkins Named Walter Camp Preseason All-American

Eric Morris’ Coaching Staff Has More in Common with Contenders than Big 12 Newcomers

Player Rating Superlatives: A Look at the Fastest, Strongest Cowboys in EA Sports’ College Football 27

Steve Lutz Releases Statement on Kashie Natt’s Eligibility Pursuit

Oklahoma State’s Offense Well Represented on Big 12 All-Portal Team

Daily Bullets (July 5): Some Predix for OSU Football

Daily Bullets (July 4): Can the Defense Match the Offense, Happy 250th, America!

Texas Tech, Colorado Headline Big 12’s Top Defensive Portal Additions This Offseason

The Reload Ep. 53: World Cup Grass, Big 12 Media Days Preview

Daily Bullets (July 3): The All-Portal Pokes
-
 Football5 days ago
Oklahoma State Running Back Caleb Hawkins Named Walter Camp Preseason All-American
-
 Football4 days ago
Eric Morris’ Coaching Staff Has More in Common with Contenders than Big 12 Newcomers
-
 Football4 days ago
Player Rating Superlatives: A Look at the Fastest, Strongest Cowboys in EA Sports’ College Football 27
-
 Hoops4 days ago
Steve Lutz Releases Statement on Kashie Natt’s Eligibility Pursuit