
Football
Where OSU’s Offense and Defense Ranked This Season (And How it Compares to Season’s Past)
😬
With only a handful of mostly meaningless bowl games left (and, oh yeah, the national championship game), the sample size for the 2022 football season is 99.9% complete. So how did OSU fare on both sides of the ball coming out of a disappointing season?
I crunched the numbers (OK, I googled it) and came to the conclusions below of where the offense and the defense finished nationally using non-advanced metrics. For the Dave Hudsons of the world, I also included some slightly more advanced metrics to satisfy the hunger for a more complete look at things from an efficiency perspective.
Let’s start with the offense using yards per game (total offense) as the baseline and work to the defense before getting into more numbers. As a reminder, there are 131 teams at the FBS level in college football.
Offensive ranks nationally/Big 12 this season
| Total offense rank | Yards/g | Big 12 rank |
| No. 53 (out of 131) | 405.1 | 8 (out of 10) |
Defensive ranks nationally/Big 12 this season
| Total defense rank | Yards/g | Big 12 rank |
| No. 115 (out of 131) | 435.7 | 8 (out of 10) |
Now some (slightly) more advanced numbers: points per play. This blocks out the noise for teams that either ran a ton of plays or were limited to fewer plays and provides a bigger picture for how efficient a unit was. Again let’s start with the offensive side of the ball.
| Points/play rank | Points/play | Big 12 rank |
| No. 81 (out of 131) | 0.349 | 9 (out of 10) |
Now we go again to the defensive side of the ball for points per play data. You can see statistically OSU’s rank nationally is slightly better but only marginally. It helps that a lot of Big 12 teams were really, really bad.
| Points/play rank | Points/play | Big 12 rank |
| 73 (out of 131) | 0.392 | 6 (out of 10) |
Where things compare to past OSU seasons
We know this season was a disappointment, but how do we compare it and contextualize it? Was it bad luck? Was it just a bad finish to the season? Where does the offense and defense rank historically?
I tried to answer that as best I could below with a look at where things finished this season and how they compared to other seasons. For this exercise I used points per play data because it does seem to block out some noise and even out total plays run by presenting a more complete picture of efficiency.
Let’s again start on offense where, somehow, the 2022 season’s efficiency was worse than the dreadful 2014 season on a points-per-play basis and a national rank basis. Using this metric the only less-efficient offense under Mike Gundy was his first one in 2005.
| Year | Points/play | Natl rank |
| 2022 | 0.349 | 81 |
| 2021 | 0.406 | 52 |
| 2020 | 0.379 | 70 |
| 2019 | 0.419 | 47 |
| 2018 | 0.464 | 22 |
| 2017 | 0.570 | 4 |
| 2016 | 0.484 | 21 |
| 2015 | 0.516 | 10 |
| 2014 | 0.365 | 75 |
| 2013 | 0.486 | 18 |
| 2012 | 0.539 | 6 |
| 2011 | 0.634 | 1 |
| 2010 | 0.586 | 4 |
| 2009 | 0.375 | 63 |
| 2008 | 0.553 | 9 |
| 2007 | 0.452 | 23 |
| 2006 | 0.512 | 8 |
| 2005 | 0.291 | 93 |
Now to the defense. The offensive numbers tell a story of historically very quality production. The defensive numbers, as expected, do not. Howevah, it’s still not too flattering to look at and a pretty stark drop off from the last few years where the unit was either top 25 or flirting with it.
| Year | Points/play | Natl rank |
| 2022 | 0.392 | 73 |
| 2021 | 0.271 | 10 |
| 2020 | 0.317 | 27 |
| 2019 | 0.381 | 57 |
| 2018 | 0.430 | 83 |
| 2017 | 0.384 | 63 |
| 2016 | 0.358 | 49 |
| 2015 | 0.397 | 74 |
| 2014 | 0.411 | 83 |
| 2013 | 0.28 | 13 |
| 2012 | 0.371 | 51 |
| 2011 | 0.311 | 26 |
| 2010 | 0.313 | 28 |
| 2009 | 0.315 | 31 |
| 2008 | 0.398 | 74 |
| 2007 | 0.418 | 82 |
| 2006 | 0.394 | 82 |
| 2005 | 0.461 | 106 |


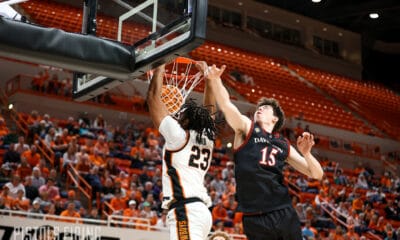
Cowboys’ Highly Touted Freshman Class and Slimmed Down Sophomores Signal Bright Future

Oklahoma State Football Announces New Futuristic Partnership

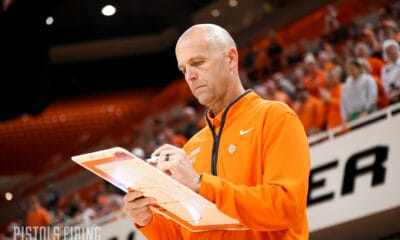
Oklahoma State Hoping to Use Puerto Rico Trip to Springboard Cowboys Ahead of Schedule

The Reload Ep. 55: OSU Basketball Headed to Puerto Rico, OSU Football Picking Up National Coverage

Daily Bullets (July 23): Pokes Trying to Make NFL Rosters

Daily Bullets (July 27): Pokes Win International Opener, Hosting Army Wrestlers

Five Thoughts on Oklahoma State’s First Game in Puerto Rico

MLB Roundup: Mestemaker Throws First Pitch, Benge Throws Out MVP

Daily Bullets (July 26): Eric Morris on Recruiting Challenge, Where BPS Ranks among Big 12 Stadiums

Daily Bullets (July 25): Best Point Guard Since Cade?
-
 Hoops5 days ago
Cowboys’ Highly Touted Freshman Class and Slimmed Down Sophomores Signal Bright Future
-
 Football4 days ago
Oklahoma State Football Announces New Futuristic Partnership
-
 Hoops5 days ago
Oklahoma State Hoping to Use Puerto Rico Trip to Springboard Cowboys Ahead of Schedule
-
 Football5 days ago
The Reload Ep. 55: OSU Basketball Headed to Puerto Rico, OSU Football Picking Up National Coverage