
Football
A Ranking of the 2017 Big 12 Defenses Reveals Very Different Trends Heading Into Bedlam
I saw an interesting question on Twitter on Saturday after Oklahoma State’s defense stymied Dana Holgorsen’s offense in Morgantown: Which defense, right now, is the best in the Big 12.
This is an excellent question https://t.co/eaHFHWnmAf
— Mark Cooper (@mark_cooperjr) October 29, 2017
There are innumerable ways to determine this, of course, but I thought of one I haven’t seen yet. Look at how efficient a team’s offense is in Big 12 games only (PPD in B12 games) and see if your defense was able to hold them below that.
Here’s how the offenses rank in PPD for Big 12 games.
| Team | PPD |
|---|---|
| Oklahoma | 3.33 |
| Oklahoma State | 2.76 |
| West Virginia | 2.61 |
| Texas Tech | 2.47 |
| TCU | 2.15 |
| Kansas State | 2.11 |
| Iowa State | 1.85 |
| Baylor | 1.71 |
| Texas | 1.71 |
| Kansas | 0.96 |
OU is the most efficient offense, and Kansas is the least efficient (obviously).
To evaluate defenses properly I then looked at each individual game (offensive drives only, pick-sixes and punt returns for TD don’t count against a defense) and found the expected points scored for offenses throughout the year. Again, Big 12 games only, and I should also note that for TDs I didn’t count any two-point conversions or missed extra points. I just made the value for a TD 7.
For example: Oklahoma State averages 2.76 points per drive on the year. They had 13 offensive drives against Baylor which means their expected points number is 35.9. Baylor actually gave up 59 in their game. Not good for the Baylor defense!
Anyway, I tallied up all the expected vs. actual points for defenses so far this season. I think it gives a pretty good indicator of how each defense has performed.
Here they are, ranked (lower is better here).
Actual vs. Expected
| Rank | Team | Actual vs. Expected | Per Game |
|---|---|---|---|
| 1 | Texas | -75.2 | -15.0 |
| 2 | Iowa State | -68.0 | -13.6 |
| 3 | TCU | -55.2 | -11.0 |
| 4 | Oklahoma State | -28.0 | -5.6 |
| 5 | Kansas State | 26.9 | 5.4 |
| 6 | Texas Tech | 29.4 | 5.8 |
| 7 | West Virginia | 36.6 | 7.3 |
| 8 | Oklahoma | 42.6 | 8.5 |
| 9 | Baylor | 43.0 | 8.6 |
| 10 | Kansas | 48.0 | 9.6 |
What this means is that Texas has given up 75 fewer points than you would have expected them to have given up so far this year based on the offenses their defense has faced. Here’s their game by game log.
Texas Defensive Log
| Team | Expected | Actual |
|---|---|---|
| Baylor | 29.1 | 7 |
| Iowa State | 24.0 | 7 |
| Kansas State | 31.7 | 34 |
| Oklahoma | 40.0 | 30 |
| Oklahoma State | 41.4 | 13 |
Texas faced 15 offensive drives from Oklahoma State which means OSU should have scored 41+ points based on their offensive efficiency. The Horns held them to 13. That’s crazy, and it’s one reason they have what I think Texas is the best defense in the Big 12.
Now let’s look at the Pokes.
Oklahoma State’s defensive log
| Team | Expected | Actual |
|---|---|---|
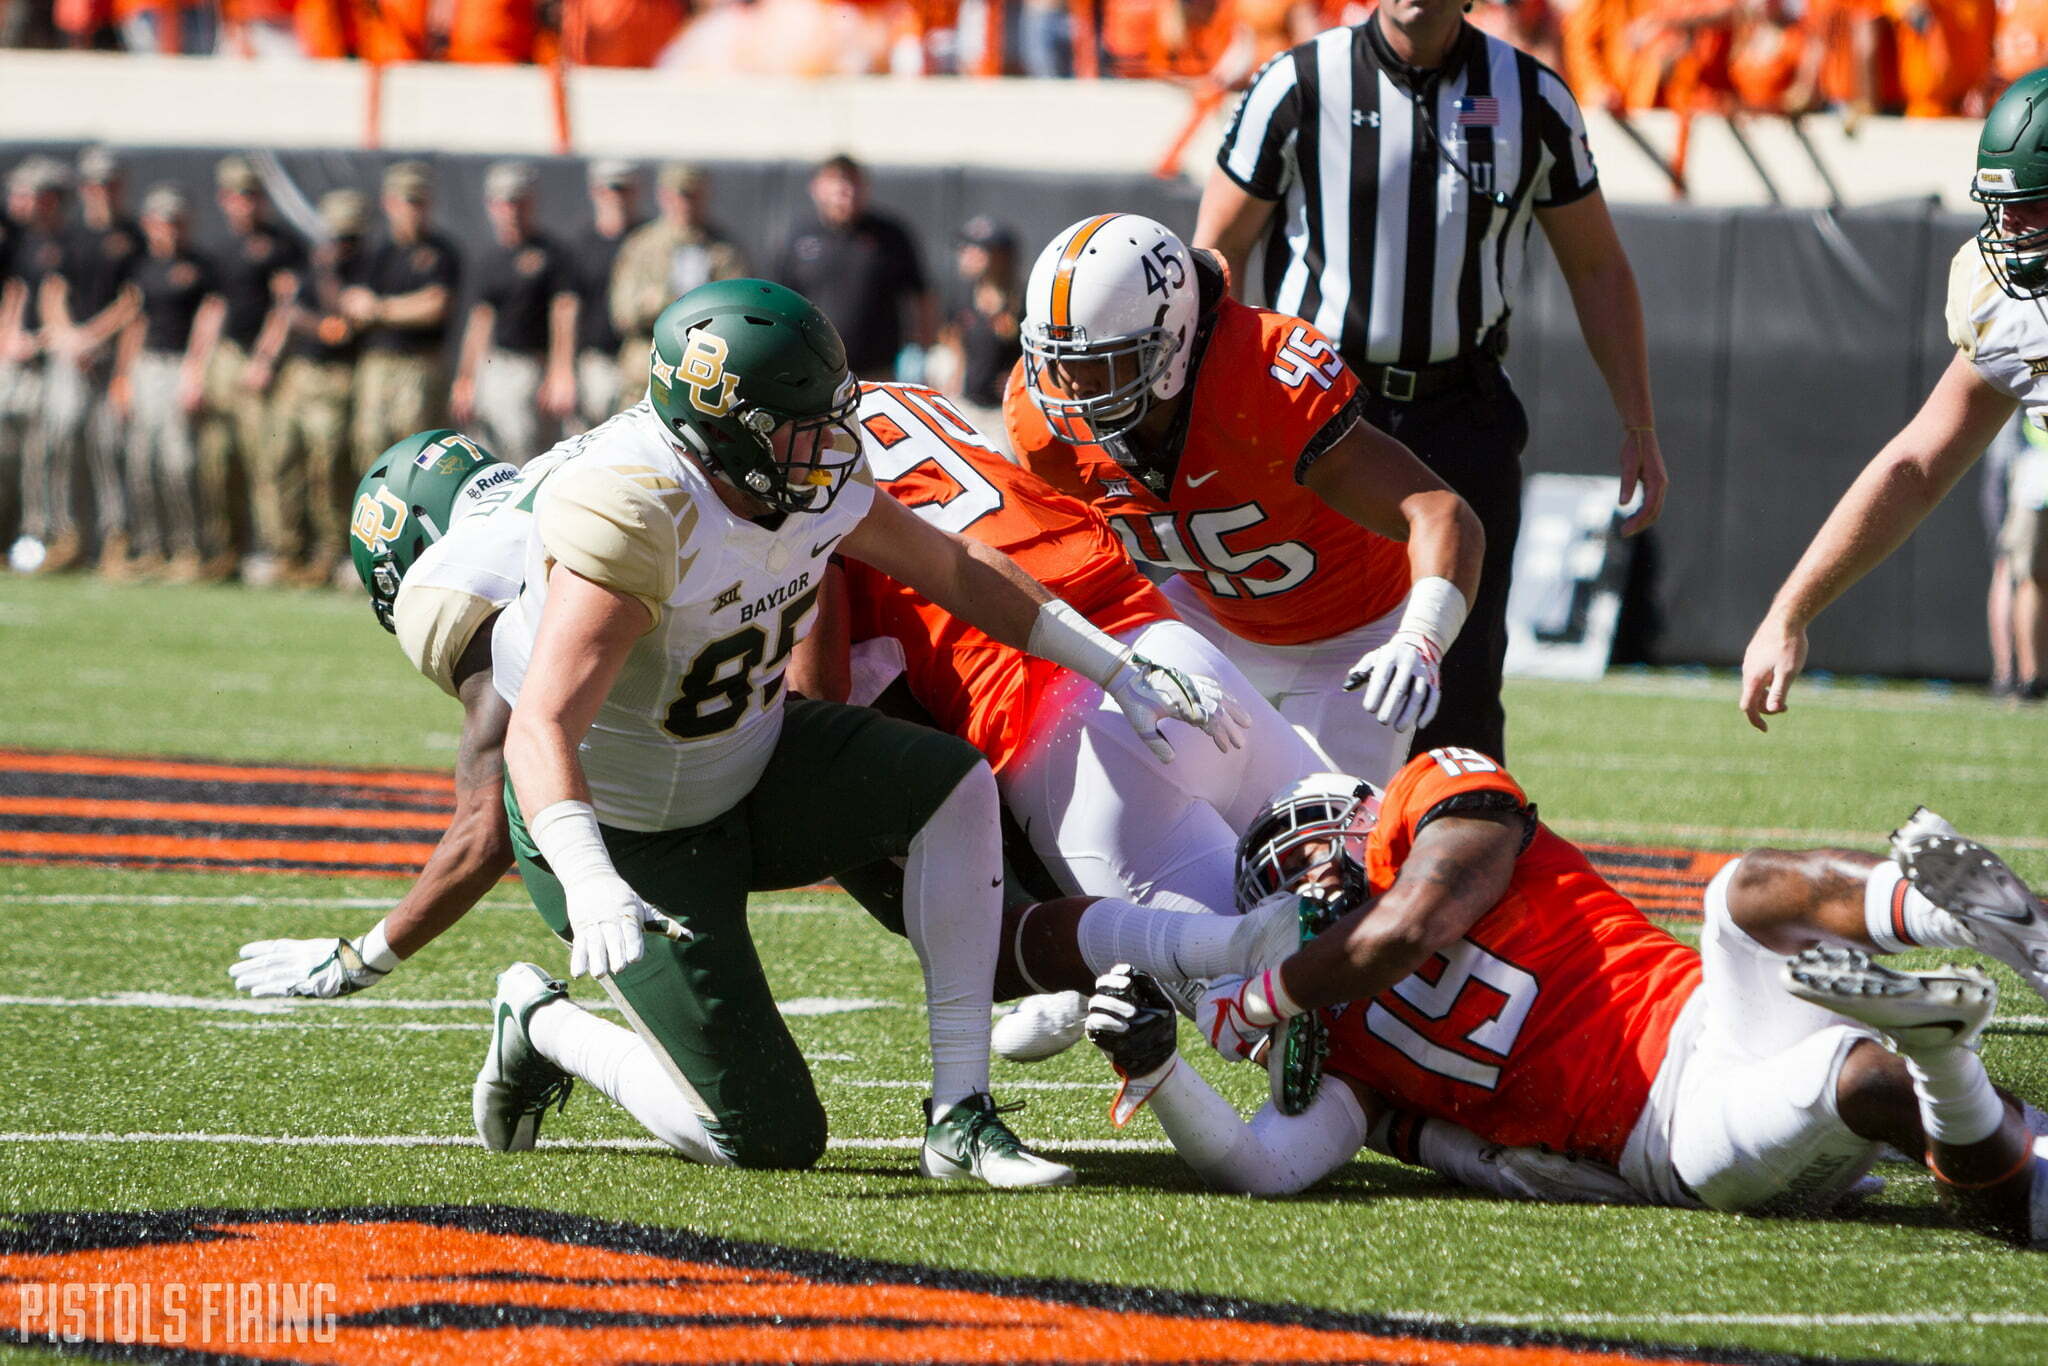
| Baylor | 24.0 | 16 |
| TCU | 28.0 | 44 |
| Texas | 25.6 | 10 |
| Texas Tech | 29.6 | 27 |
| West Virginia | 41.7 | 24 |
As you can see, the Cowboys have had four plus games and one fat minus. Four times they have held opponents to below their season average, with the best ones coming against Texas and WVU (your eyes did not deceive you).
And finally, OU.
OU defensive log
| Team | Expected | Actual |
|---|---|---|
| Baylor | 25.7 | 40 |
| Iowa State | 18.5 | 37 |
| Kansas State | 25.4 | 35 |
| Texas | 22.2 | 24 |
| Texas Tech | 29.6 | 28 |
Every team except for Texas Tech has exceeded its expected offensive points per drive output against OU so far this season. Oddly, there has been something weird with extra points in nearly every OU game. Baylor actually scored 41, ISU actually scored 38 and Tech actually scored 27. It doesn’t affect the data much, but I’m pointing it out because I kept the value of a TD given up at 7 regardless of the XP which is why some of the numbers don’t match.
Based on this, and from what I’ve seen thus far, I think Oklahoma State has a top four Big 12 defense and that OU has a bottom four or five. That should mean OSU can control the game on Saturday in Bedlam. Will it pan out like that? Who knows, I’ve seen too many poor Bedlam performances to truly believe, but I do think this is one aspect of this game that’s going a little bit underrated.
Related Coverage


Oklahoma State Running Back Caleb Hawkins Named Walter Camp Preseason All-American

Eric Morris’ Coaching Staff Has More in Common with Contenders than Big 12 Newcomers

Player Rating Superlatives: A Look at the Fastest, Strongest Cowboys in EA Sports’ College Football 27

Steve Lutz Releases Statement on Kashie Natt’s Eligibility Pursuit

Oklahoma State’s Offense Well Represented on Big 12 All-Portal Team

Daily Bullets (July 5): Some Predix for OSU Football

Daily Bullets (July 4): Can the Defense Match the Offense, Happy 250th, America!

Texas Tech, Colorado Headline Big 12’s Top Defensive Portal Additions This Offseason

The Reload Ep. 53: World Cup Grass, Big 12 Media Days Preview

Daily Bullets (July 3): The All-Portal Pokes
-
 Football5 days ago
Oklahoma State Running Back Caleb Hawkins Named Walter Camp Preseason All-American
-
 Football4 days ago
Eric Morris’ Coaching Staff Has More in Common with Contenders than Big 12 Newcomers
-
 Football4 days ago
Player Rating Superlatives: A Look at the Fastest, Strongest Cowboys in EA Sports’ College Football 27
-
 Hoops4 days ago
Steve Lutz Releases Statement on Kashie Natt’s Eligibility Pursuit