
Football
Defense Tracker: Cowboys Boost Turnover Totals in TCU Loss
But OSU also allowed the Horned Frogs 501 total yards.
The Cowboys’ 2020 defense is statistically falling off pace as the best in the Mike Gundy era, but it has still been dang good.
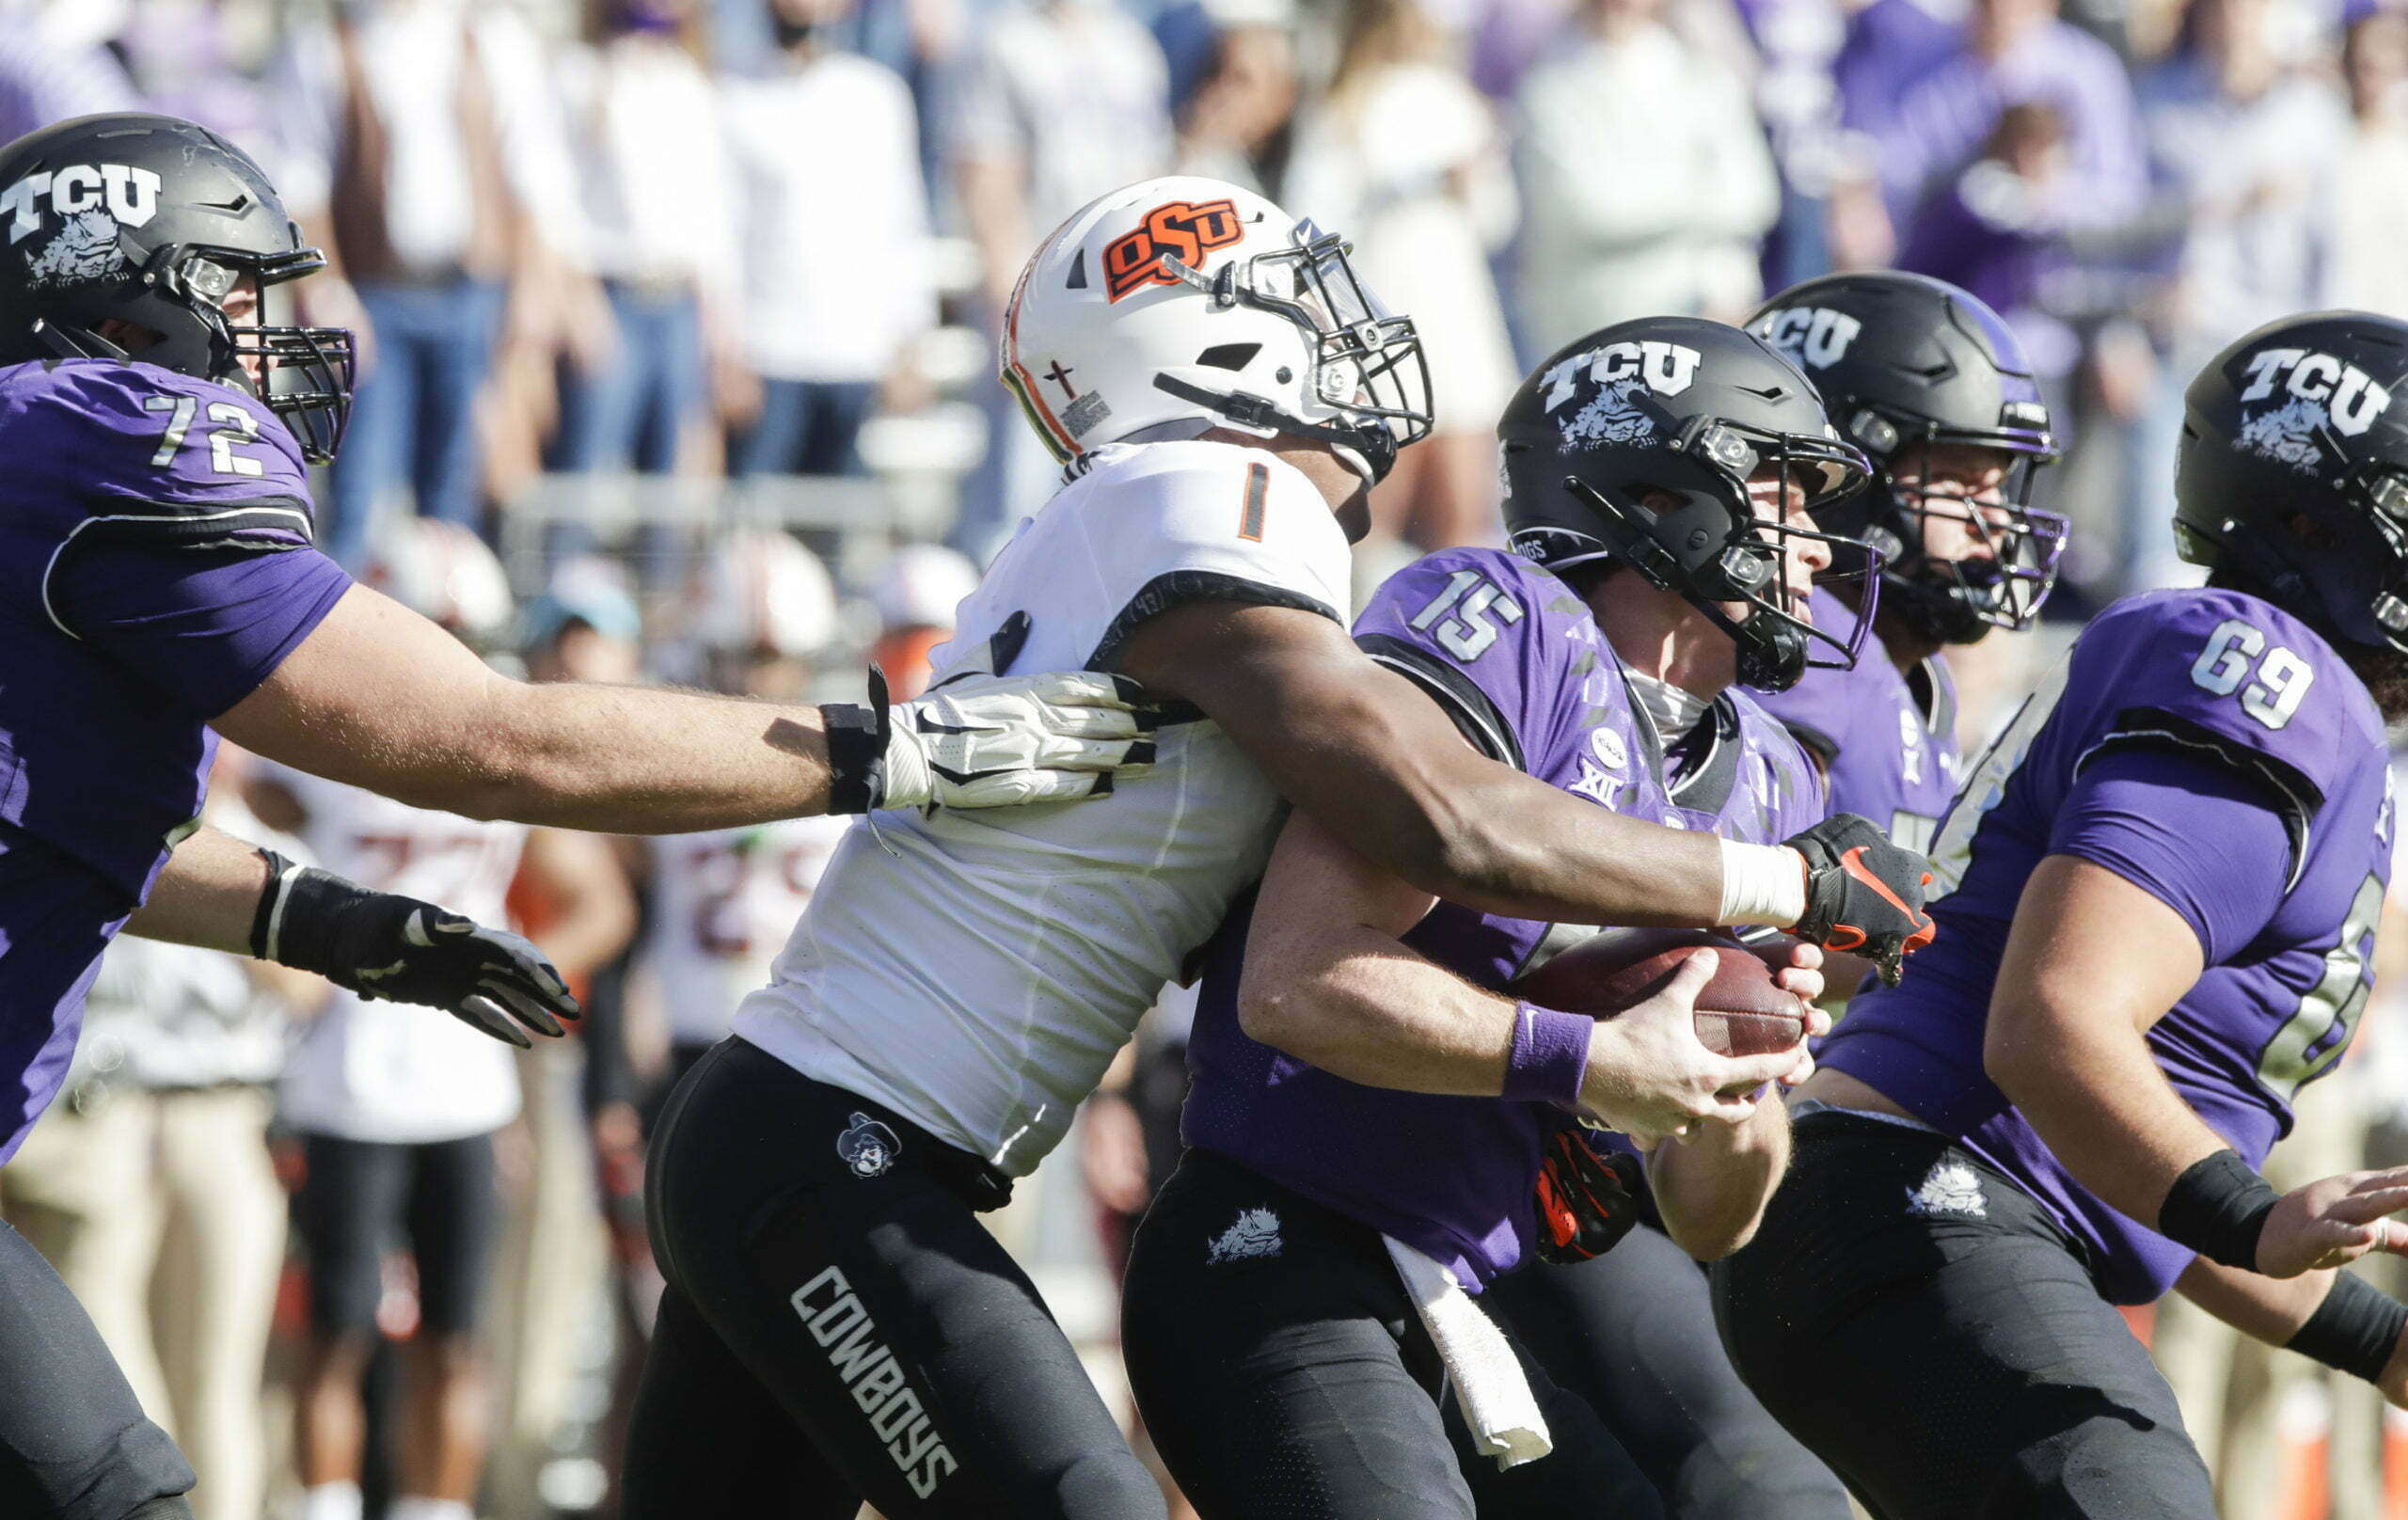
In Oklahoma State’s 29-22 loss to TCU on Saturday in Fort Worth, the Cowboys forced a season-high five turnovers, thanks in large part to Amen Ogbongbemiga’s mitts. Ogbongbemiga forced a school record three fumbles against the Horned Frogs.
“We just try to change the game every single play,” Ogbongbemiga said after the TCU loss. “No matter what happens on the other side of the ball, we could always go out there and change the game, change the narrative of the game. That’s been our mentality the whole season, and it’s come to light the last few weeks. Turnovers, everybody’s trying to get their own. Everybody’s trying to get in on the turnover game.
“At the end of the day, it wasn’t enough. We had more to prove. We didn’t hold them to win the game, so we still gotta get back to work. We got a lot more to work on. We gave up way too many big plays. We gotta look ourselves in the mirror and really find who we are and reidentify who we wanna be.”
As we do every week, let’s look at how this defense stacks up stastically with every defense Gundy has had in his 16-year tenure.
| Year | Points per game | Total offense per game | Turnovers per game | Third-Down Conversions |
|---|---|---|---|---|
| 2005 | 31.3 | 419.6 | 1.8 | 54-for-158 (34%) |
| 2006 | 25.6 | 364.1 | 2 | 67-for-169 (37%) |
| 2007 | 29.5 | 443 | 1.5 | 78-for-189 (41%) |
| 2008 | 28.1 | 405.5 | 1.5 | 71-for-177 (40%) |
| 2009 | 21.7 | 332.5 | 2.3 | 65-for-191 (34%) |
| 2010 | 26.4 | 409.5 | 2.6 | 104-for-239 (44%) |
| 2011 | 26.8 | 456.8 | 3.4 | 89-for-213 (42%) |
| 2012 | 28.2 | 421.7 | 1.7 | 78-for-215 (36%) |
| 2013 | 21.6 | 384.9 | 2.5 | 72-for-229 (31%) |
| 2014 | 31.2 | 432 | 1.1 | 84-for-206 (41%) |
| 2015 | 30.5 | 439.1 | 2.9 | 89-for-211 (42%) |
| 2016 | 26.5 | 446.3 | 1.9 | 76-for-195 (39%) |
| 2017 | 29.4 | 409.3 | 1.8 | 80-for-206 (39%) |
| 2018 | 32.5 | 452.5 | 1 | 71-for-189 (38%) |
| 2019 | 26.8 | 412.3 | 1.5 | 75-for-191 (39%) |
| 2020 | 24.6 | 389 | 1.6 | 36-for-135 (27%) |
The Pokes allowed 501 yards of total offense and 29 points, bumping up their season averages in both stats. The Horned Frogs were also able to convert on 41 percent of their third-down attempts, something that happens for running teams.
The seasons we’ve most closely compared this defense to are OSU’s defenses from 2009 and 2013. Here is a closer look at how the 2020 numbers stack up with those:
| Year | Points per game | Total offense per game | Turnovers per game | Third-Down Conversions |
|---|---|---|---|---|
| 2009 | 21.7 | 332.5 | 2.3 | 65-for-191 (34%) |
| 2013 | 21.6 | 384.9 | 2.5 | 72-for-229 (31%) |
| 2020 | 24.6 | 389 | 1.6 | 36-for-135 (27%) |
With the Baylor game and a bowl to go, there is still a chance this 2020 defense can improve on its season averages, but things have been trending in the wrong direction for the past few weeks.
Baylor ranks ninth in the Big 12 in points per game at 25.9. The Bears’ 329.5 yards per game is also ninth in the Big 12, so this could be a good opponent for the Cowboys defense to pad some stats.
“Our mentality is to shut every single person out,” Ogbongbemiga said. “We’ve allowed too many big plays these last few weeks. That’s been killing us. We’ve obviously got a lot more turnovers, but we can’t be allowing 60-yard plays down the field. That’s how you lose games. We’ve gotta stop allowing those to happen.
“You can’t ever be proud of no performance when you lose. We just got so much to work on, and everybody gotta come with their hardhat and look ourselves in the face. We lost that game as a defense. It wasn’t the coaches. The coaches were putting us in good positions. It’s us as the players figuring out what we’re made of. We just gotta come to work.”


Oklahoma State’s Offense Well Represented on Big 12 All-Portal Team

Marcus Smart Signs with Houston Rockets

Texas Tech, Colorado Headline Big 12’s Top Defensive Portal Additions This Offseason

Report: Judge Deems Kashie Natt Eligible

Daily Bullets (July 6): Holliday Lands an Outfielder, Rickie and Preston Stout Tie at John Deere

Daily Bullets (July 7): Cowboy Deemed Eligible by Judge, Pokes on Preseason All-Big 12 Team

Drew Mestemaker Named Big 12 Newcomer of the Year, Wyatt Young on Preseason All-Big 12 Team
Report: Judge Deems Kashie Natt Eligible
Daily Bullets (July 6): Holliday Lands an Outfielder, Rickie and Preston Stout Tie at John Deere

Daily Bullets (July 5): Some Predix for OSU Football
-
 Football5 days ago
Oklahoma State’s Offense Well Represented on Big 12 All-Portal Team
-
 Hoops5 days ago
Marcus Smart Signs with Houston Rockets
-
 Football4 days ago
Texas Tech, Colorado Headline Big 12’s Top Defensive Portal Additions This Offseason
-
 Hoops23 hours ago
Report: Judge Deems Kashie Natt Eligible