
Football
Drive Charts: Oklahoma State Was Ultra Efficient Offensively Against Boise
OSU only got 10 real possessions on Saturday, and they took advantage of them.
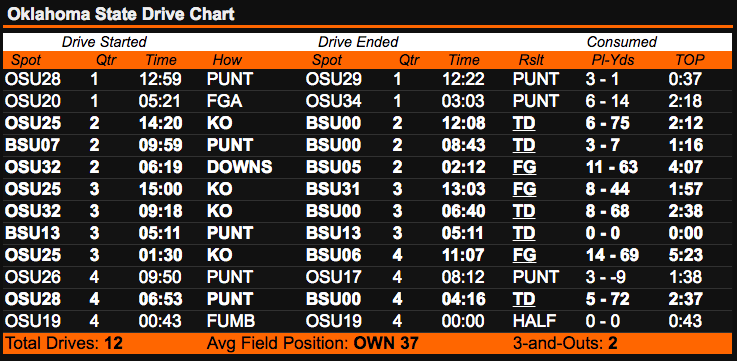
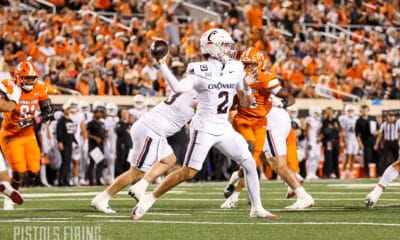
Oklahoma State pounded Boise State on Saturday in Stillwater, although you might not be able to tell it from these drive charts. The Pokes did it every way you could possibly do it other than running the Annexation of Puerto Rico in the thickest parts of Mike Gundy’s hair. Let’s take a look at the 24 combined drives from Stillwater (a small number, by the way, for a game involving a Big 12 team).
When, two months from now, people are saying “I TOLD YOU SO” about Taylor Cornelius as the 9-0 Pokes head to Bedlam, keep this drive chart handy and remind them that nobody, least of all “I told you so” guy — a football genius of course — felt great about anything going into the second quarter of the biggest game of the year to date.
OSU’s Pertinent Stats
• Points per drive (offense): 3.7 (taking out the punt block TD)
• Yards per play: 6.6
• Third-down conversions: 7/13 (54 percent)
• Average starting field position: own 37-yard line
• Red-zone scoring: 5/5 (3 touchdowns)
• Points off turnovers: 0
• Time of possession: 25:26
Of course OSU also reeled off seven scores on eight offensive drives to end the game so hey, maybe Cornelius is going to join Brandon Weeden as the only Big 12 title-winning QBs to play at Oklahoma State. One number that pops to me is the red zone scoring. It’s an illusion. OSU is 16 of 18 this year on scoring inside the red zone but ranks 84th in the country in TD percentage.
Lastly, I did not expect to see that 3.7 number on PPD. That’s an elite number, and it did not feel like OSU was elite from an offensive efficiency standpoint. I guess it makes sense, though, considering they nearly scored 40 on offense with only 10 true possessions.
I love seeing those three and outs. I don’t love seeing those 14-play drives.
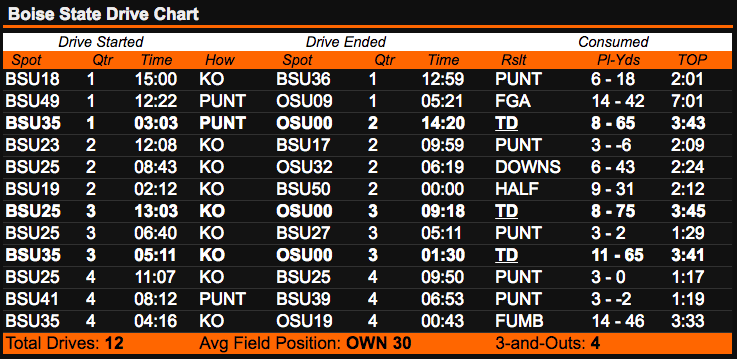
BSU’s Pertinent Stats
• Points per drive (offense): 1.8
• Yards per play: 4.8
• Third-down conversions: 11/22 (50 percent)
• Average starting field position: own 30-yard line
• Red-zone scoring: 1/3 (1 touchdown)
• Points off turnovers: 0
• Time of possession: 34:34
Boise had 23 first downs on Saturday — which is kind of a lot — and only two of those came on rushes. Turns out, it’s hard to move the chains when you average 1.1 yards per rush. Also, I know OSU’s special teams set it up for a TD on one of the blocked punts, but it did not feel like OSU was 2 points more efficient per offensive drive than Boise State.
Here are Boise’s rushing stats by quarter …
• 1st quarter: 10 carries | 2.5 YPC
• 2nd quarter: 10 carries | 0.6 YPC
• 3rd quarter: 6 carries | 1.8 YPC
• 4th quarter: 5 carries | -1.6 YPC
#FourthQuarterbyGlass


Report: Big 12 ADs Have ‘Serious’ Talks about Not Playing Texas Tech Following Sorsby Ruling

Sorsby’s Temporary Injunction the Latest Example of How Broken College Athletics Is

Parsa Fallah, Kashie Natt Seeking Eligibility Waivers to Play at Oklahoma State Next Season

A Look at Four of the Prospects Oklahoma State Is Set to Host This Week

‘Not Enough to Make the NCAA Tournament’: Steve Lutz Is Aiming High This Season

Oklahoma Attorney General Pushes for Big 12 to Suspend Brendan Sorsby, Offers Legal Support

How Oklahoma State’s Best Defenders Stack Up with Big 12
Pistols Firing Podcast Ep. 707: Sorsby Saga and Remembering Bob Simmons

Daily Bullets (June 12): Hoops Conference Opponents Announced

Steve Lutz Leaned More Heavily on Personality Test When Constructing Oklahoma State’s Roster
-
 Football4 days ago
Report: Big 12 ADs Have ‘Serious’ Talks about Not Playing Texas Tech Following Sorsby Ruling
-
 Football5 days ago
Sorsby’s Temporary Injunction the Latest Example of How Broken College Athletics Is
-
 Hoops3 days ago
Parsa Fallah, Kashie Natt Seeking Eligibility Waivers to Play at Oklahoma State Next Season
-
 Football3 days ago
A Look at Four of the Prospects Oklahoma State Is Set to Host This Week