
Football
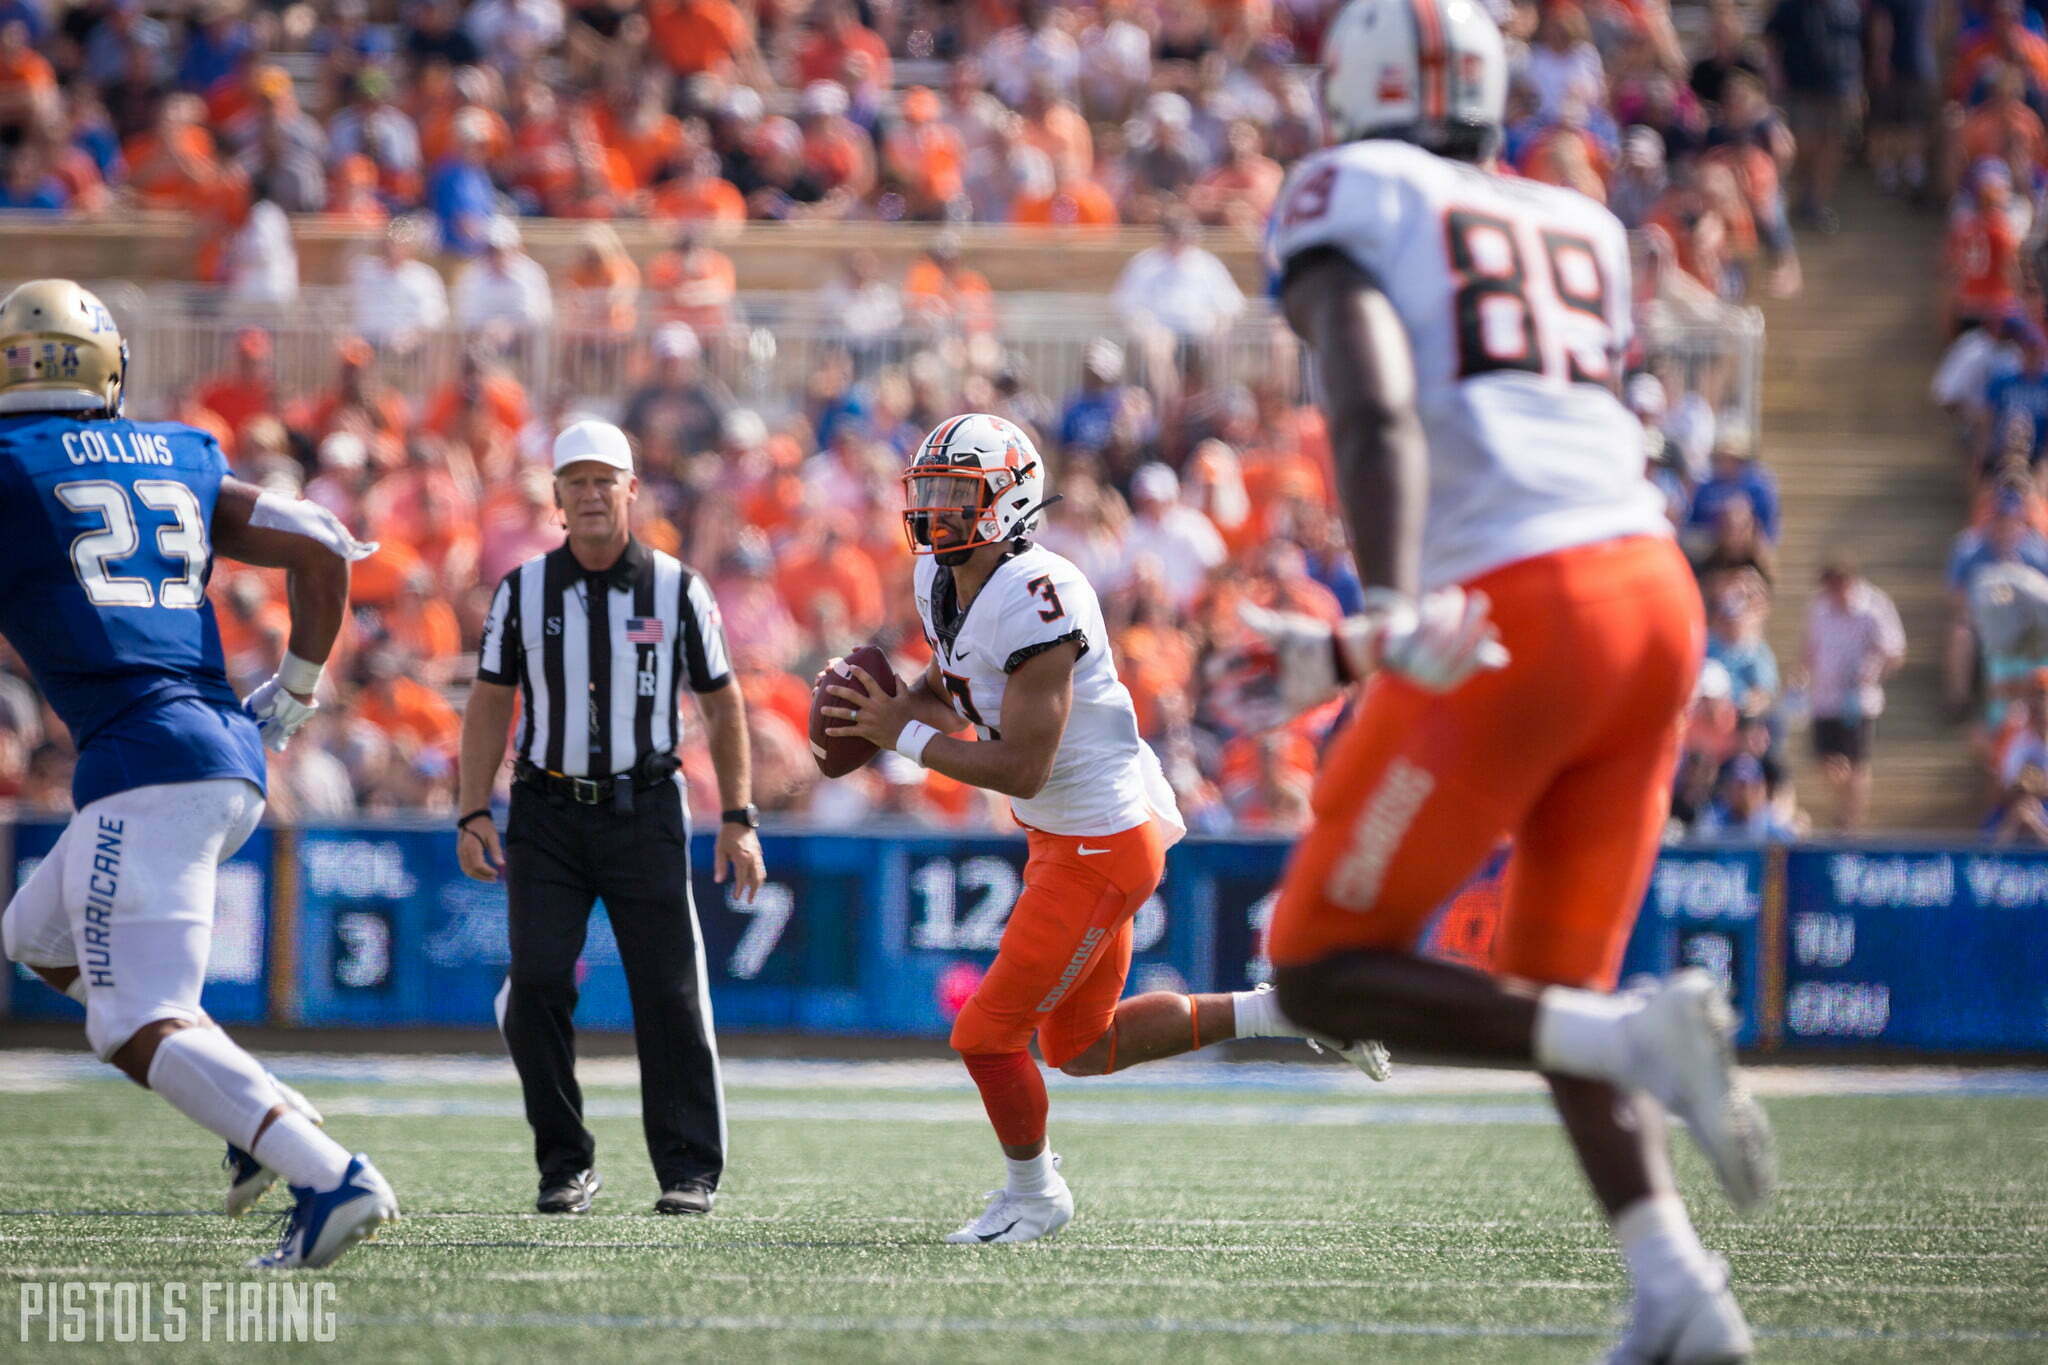
Five Stats that Have Defined Oklahoma State’s 2019 Season So Far
Spencer’s efficiency and Chuba’s workload are prominently featured.
It feels as if OSU world is fairly morose right now. I don’t know if that’s because the weather finally broke and everyone is outside instead of huddled over a website on a screen or if the fresh scent of the new season has finally evaporated, but the whole thing needs a jolt (C. Cunningham, where art thou announcement?)
I don’t know that five stats about OSU’s 2019 season is what’s going to provide said jolt, but maybe one of them will get one of you fired up about something. As I dug around OSU’s season-long stats, I found some fascinating ones as we hurtle toward the second half of Mike Gundy’s 15th year at the helm in Stillwater.
2.25 — That’s how many points per drive Oklahoma State is allowing this season (No. 68 nationally). That’s a good number, right? OSU has been good on defense this year, right? Well … not so much. If the season ended today it would actually be tied for the second-worst number since 2008. OSU allowed 2.55 points per drive last year (worst since these things started being kept). Other than a 2.25 number in the great season of 2014, you have to go back to 2008 when they allowed 2.44 points per drive — and wasted one of the better offenses of the Gundy era — to find something that’s been worse than 2019 so far. The reason? See No. 2.
3 — That’s how many Power 5 teams have created fewer turnovers in the Jim Knowles era than Oklahoma State, which has created 19 turnovers in the Jim Knowles era. That’s 13 last season (which ranked No. 115) and six this season (which ranks No. 102). Only OU (!), USC and Oregon State have created fewer than 19 between these two seasons. I think it’s one primary reason their PPD number is higher than it seems like it is. They almost never stop drives by creating turnovers and getting momentum going in the opposite direction.
11 — That’s the number of single seasons in the Gundy era in which a running back has toted the ball more times than Chuba Hubbard has through six games. If he continues his current pace for all 13 games (and he barely played against McNeese!), this will be the Gundy-era top five for most carries in a single season.
- Chuba Hubbard (2019) — 351
- Joe Randle (2012) — 274
- Kendall Hunter (2010) — 271
- Justice Hill (2017) — 268
- Kendall Hunter (2008) — 241
???
Seems not great!
144.9 — You might not know what passer efficiency rating is — and I might not either — but through six games, Spencer Sanders’ is 144.9. That’s situated between Bobby Reid’s sophomore season and Taylor Cornelius last year, which seems about right for the season he’s had. The top 10 of the Gundy era is taken up by Rudolph, Weeden and Robinson mostly (with a little J.W. sprinkled in). I think it speaks to how Sanders has been both irrationally good and unfathomably bad at different points this year.
.02 — That’s the percentage chance 538 gives OSU of winning the Big 12. One out of 50 times the rest of the year is played out, OSU is the champ. That rises to 3 percent if they beat Baylor this weekend. And while I don’t think anyone came into the year believing that OSU was going to make a 13-game run at the Big 12 crown and CFP, you would have at least liked to have extended hope beyond just three games into the conference scene.


Oklahoma State Wins All-Sports Bedlam for Sixth Time in Last Seven Years

Report: Kashie Natt Files Lawsuit Against NCAA Seeking Eligibility

Viktor Hovland Outlasts Scottie Scheffler to Win Traveler’s Championship

Fixing the Group of Five: A Fun Idea to Bring Promotion-Relegation to College Football

2025–26 Oklahoma State Final Grades: Cowboy Golf, Track End the Year on High Notes

Texas Tech, Colorado Headline Big 12’s Top Defensive Portal Additions This Offseason

The Reload Ep. 53: World Cup Grass, Big 12 Media Days Preview

Daily Bullets (July 3): The All-Portal Pokes

Oklahoma State’s Offense Well Represented on Big 12 All-Portal Team

Marcus Smart Signs with Houston Rockets
-
 Baseball4 days ago
Oklahoma State Wins All-Sports Bedlam for Sixth Time in Last Seven Years
-
 Hoops4 days ago
Report: Kashie Natt Files Lawsuit Against NCAA Seeking Eligibility
-
 Golf4 days ago
Viktor Hovland Outlasts Scottie Scheffler to Win Traveler’s Championship
-
 Football4 days ago
Fixing the Group of Five: A Fun Idea to Bring Promotion-Relegation to College Football