
Football
Let’s Compare Army’s Defense to Oklahoma State’s
How do they stack up?
Mike Gundy started speaking my language on Monday at Big 12 Media Days when he said these sweet, delectable words.
“It has to be (measured by) points per possession,” Gundy said according to The Oklahoman. “(At Army), they did a fantastic job of coaching, but you can’t compare their defensive coordinator’s points-allowed to the coordinators in our league. Army’s defense is on the field for nine possessions a game. Our guys are out there 14, 15 or maybe 16 a game. If you go by (points per possession), you’re going to get a fair statistic.”
Yes! Preach, O Hairy One!
This was something that was also (sort of) noted by the Big 12 as a whole, albeit indirectly, throughout the day. Here’s what commish Bob Bowlsby said.
“One particular statistic I would like you all to make note of,” said Bowlsby, “I want to see pencils moving and fingers tapping on this. Last year of our seven bowl games, six of the seven were held below their season averages offensively by Big 12 defenses. Six of seven offenses were held below their season average by Big 12 defenses.”
Playing in the same game is the forced equivalent of points per drive, and the Big 12 thrived. Of course Gundy could look at points per game, points per drive, points per hair follicle or points per uniform combination, and none of it would have looked all that appealing in 2018. As Kyle Cox noted, OSU had one of its worst PPD seasons on defense since Gundy took over. Maybe the worst.
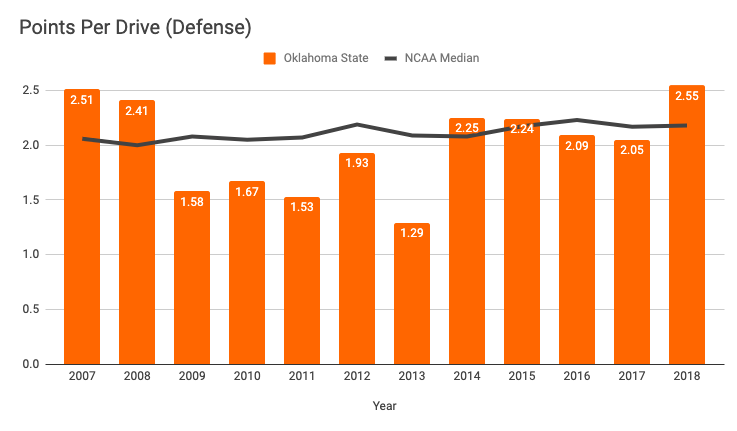
But its lows included allowing a hefty 2.55 points per drive on defense, good for eighth in the conference and 97th nationally. That’s the most points per drive that any OSU defense has allowed since BCF Toys began tracking the stat back in 2007. [PFB]
To Gundy’s point, though, this has been an anomaly. Oklahoma State has been better than the NCAA median in seven of the last 10 years. In most cases, a lot better. Here’s a look at those numbers (2013 was ?)
But just for fun, I thought it would be fun to look at the difference between Army’s numbers and OSU’s numbers just to highlight what Gundy is talking about. Here’s what I pulled for 2010-2018 in terms of points per game allowed on defense.
| OSU PPG | Army PPG | |
|---|---|---|
| 2010 | 26.4 | 24.3 |
| 2011 | 26.8 | 28.3 |
| 2012 | 28.2 | 35.3 |
| 2013 | 21.6 | 31.6 |
| 2014 | 31.2 | 32.9 |
| 2015 | 30.5 | 27.8 |
| 2016 | 26.5 | 19.8 |
| 2017 | 29.4 | 22.0 |
| 2018 | 32.5 | 17.7 |
So a 1992 College Football Fan would say that Army has had better defenses than OSU in five of the last nine years. But that’s not what you, 2019 College Football Fan, would say. Because you, 2019 College Football Fan, know that points per drive is a better determinant. Here’s a look.
| OSU PPD | Army PPD | |
|---|---|---|
| 2010 | 1.67 | 2.33 |
| 2011 | 1.53 | 2.96 |
| 2012 | 1.93 | 3.39 |
| 2013 | 1.29 | 3.14 |
| 2014 | 2.25 | 3.04 |
| 2015 | 2.24 | 2.51 |
| 2016 | 2.09 | 2.13 |
| 2017 | 2.05 | 2.56 |
| 2018 | 2.55 | 2.01 |
This tells me that last year was, maybe humorously given Gundy’s comp, the first year in the last nine that Army’s defense has been better than that of Oklahoma State.
Think of it this way — if Army and OSU played each other and their offenses were the exact same (they aren’t, by the way), then the 2015 OSU defense that looked worse than the 2015 Army defense would actually beat Army by four points in a 15-possession game (a normal Big 12 number).
This is what Gundy is getting at (and what I’ve been hollering about for the last five years).


Oklahoma State Wins All-Sports Bedlam for Sixth Time in Last Seven Years

Report: Kashie Natt Files Lawsuit Against NCAA Seeking Eligibility

Viktor Hovland Outlasts Scottie Scheffler to Win Traveler’s Championship

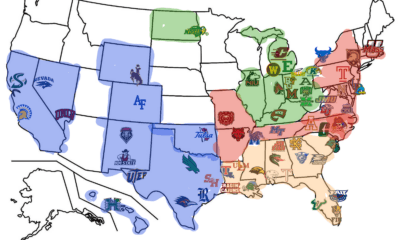
Fixing the Group of Five: A Fun Idea to Bring Promotion-Relegation to College Football

2025–26 Oklahoma State Final Grades: Cowboy Golf, Track End the Year on High Notes

Daily Bullets (July 3): The All-Portal Pokes

Oklahoma State’s Offense Well Represented on Big 12 All-Portal Team

Marcus Smart Signs with Houston Rockets

Daily Bullets (July 2): Rating the Cowboys Roster

Steve Lutz Releases Statement on Kashie Natt’s Eligibility Pursuit
-
 Baseball4 days ago
Oklahoma State Wins All-Sports Bedlam for Sixth Time in Last Seven Years
-
 Hoops4 days ago
Report: Kashie Natt Files Lawsuit Against NCAA Seeking Eligibility
-
 Golf4 days ago
Viktor Hovland Outlasts Scottie Scheffler to Win Traveler’s Championship
-
 Football4 days ago
Fixing the Group of Five: A Fun Idea to Bring Promotion-Relegation to College Football