
Football
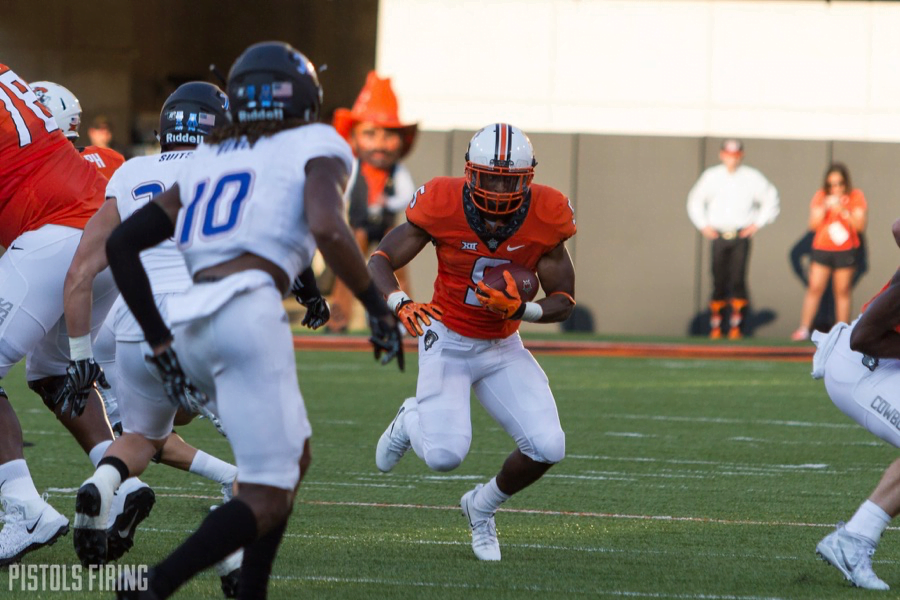
A Look at How Fast Oklahoma State is Playing This Year
One of the super nerdy stats I concocted over the years is a stat called seconds per play. I wanted to see how much time was elapsing between plays for certain teams. How fast is your offense going?
This is not the greatest stat because there is no true way to measure how fast a team is playing other than to sit there with a stopwatch during games and time it (which sounds like the work of an insane person). You have penalties that stop the clock and a variety of other things that aren’t actually part of the plays on the field.
What I’ve done, though, is take plays per game and divide that by total time of possession. This shows how many seconds elapse per play that you run. This makes teams that pass a lot and stop the clock appear as if they’re playing faster than they are and teams that run it look slower, but when you’re comparing the same program over a number of years, it mostly works.
Teams that are in the 18-19 second range are blazing fast. Teams that are around 30 are probably Kansas State.
If you go back and look at those 2008/2009 teams Mike Gundy coached, they were slower than Larry Fedora getting to the gym on leg day. Their time elapsed between plays was nearly 30 seconds.
Fast forward (literally) to Dan Holgorsen’s arrival in 2010, and you see how fast OSU became. They shaved 5 seconds off their average time between plays. That has more or less continued in the Mike Yurcich era, and this team is his fastest since 2012.
It’s likely going to become even faster once the Big 12 starts. OSU has an artificially deflated number right now because it has simply been trying to run out the clock in the second half of games this year. If you look at its first half only number, it’s more in the 20-21 range.
Anyway, here is the data for 2008-2017 for Oklahoma State.
| Year | Plays/Game | TOP/Game | Seconds/Play |
|---|---|---|---|
| 2017 | 71.0 | 27:17 | 23.1 |
| 2016 | 73.5 | 28:51 | 23.5 |
| 2015 | 75.2 | 29:29 | 23.5 |
| 2014 | 69.8 | 28:00 | 24.1 |
| 2013 | 75.9 | 26:44 | 21.1 |
| 2012 | 78.0 | 27:20 | 21.0 |
| 2011 | 75.9 | 26:18 | 20.8 |
| 2010 | 75.5 | 27:41 | 22.0 |
| 2009 | 68.5 | 31:50 | 27.9 |
| 2008 | 69.8 | 31:09 | 26.7 |
It makes sense that with a senior QB and experienced squad, this team would be faster than Yurcich’s last two. Also, having Rob Glass as a strength and conditioning coach helps you, as Yurcich pointed out this week.
“We always talk about games in a 60-minute context and how that’s what it’s going to take to be successful,” said Yurcich. “We talk about that with our guys all of the time. Our guys are conditioned extremely well.
“Coach (Rob) Glass does a heck of a job with those guys and in our past history — I don’t know how many games we’ve been in it that late — we haven’t had a problem with our guys understanding the intensity and urgency that’s required late in a ballgame and I don’t anticipate us losing that focus.”
Viscerally, OSU has seemed faster this year than any other of the Rudolph era, and the numbers back that up so far. And it has to be demoralizing to be on the receiving end of that downhill attack.
It will be interesting to see as OSU enters the conference slate whether they dial it back a little or this number creeps into the 20- or even 19-second range. Unveiling a final gear on their march towards the Big 12 title game could provide the last bump they need to eventually knock off the final boss from Norman.


Eric Morris’ Coaching Staff Has More in Common with Contenders than Big 12 Newcomers

Player Rating Superlatives: A Look at the Fastest, Strongest Cowboys in EA Sports’ College Football 27

Steve Lutz Releases Statement on Kashie Natt’s Eligibility Pursuit

Oklahoma State’s Offense Well Represented on Big 12 All-Portal Team

Daily Bullets (July 1): Caleb Hawkins a (Preseason) All-American

Daily Bullets (July 5): Some Predix for OSU Football

Daily Bullets (July 4): Can the Defense Match the Offense, Happy 250th, America!

Texas Tech, Colorado Headline Big 12’s Top Defensive Portal Additions This Offseason

The Reload Ep. 53: World Cup Grass, Big 12 Media Days Preview

Daily Bullets (July 3): The All-Portal Pokes
-
 Football4 days ago
Eric Morris’ Coaching Staff Has More in Common with Contenders than Big 12 Newcomers
-
 Football4 days ago
Player Rating Superlatives: A Look at the Fastest, Strongest Cowboys in EA Sports’ College Football 27
-
 Hoops4 days ago
Steve Lutz Releases Statement on Kashie Natt’s Eligibility Pursuit
-
 Football3 days ago
Oklahoma State’s Offense Well Represented on Big 12 All-Portal Team