
Football
By the Numbers: Pokes Come Up Short in Both Phases Against TCU
Warning: This won’t be pretty. After diving into the drive charts of Oklahoma State’s first three games, this one will look more like the first college english paper I turned in. Marred with red ink and not worth re-reading.
OSU Drive Chart
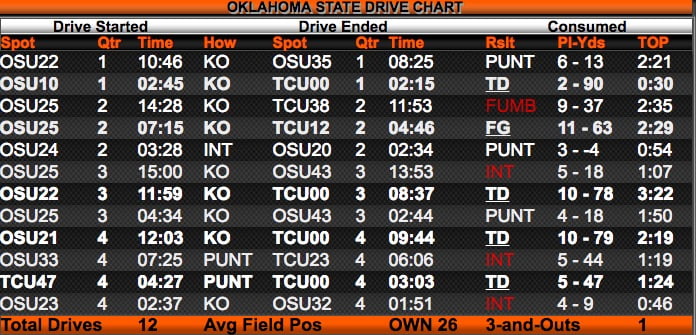
Those first six drives are … not good. Also, I was speaking metaphorically about the red ink, but this chart proves that it was literal as well. Three interceptions in the second half when you’re trying to overtake one of the better defenses in the league is not going to get it done.
OSU’s Pertinent Numbers
- Points per drive (offense): 2.58
- Points per drive (defense): 3.38
- Yards per play: 6.8
- Third-down conversions: 7/14 (50%)
- Average starting field position: own 26-yard line
- Red-zone scoring: 4/4
- Points off turnovers: 0
- Time of possession: 20:56
Gundy said after the game that they normally don’t care much about time of possession, but it did matter on Saturday since TCU ran 85 plays. OSU didn’t force a three and out until 7:25 left in the game. Interestingly, TCU’s last four drives were all three plays. Unfortunately, one of them ended with a touchdown.
People will point to the defense, and 3.38 points per drive given up is not good. But 2.58 points per drive on offense is also far below what the Pokes should be averaging against TCU.
Lastly, OSU usually does a great job on special teams and gains an advantage in average starting field position. This week? Not so much.
Now let’s look at TCU’s drive charts.
TCU Drive Chart
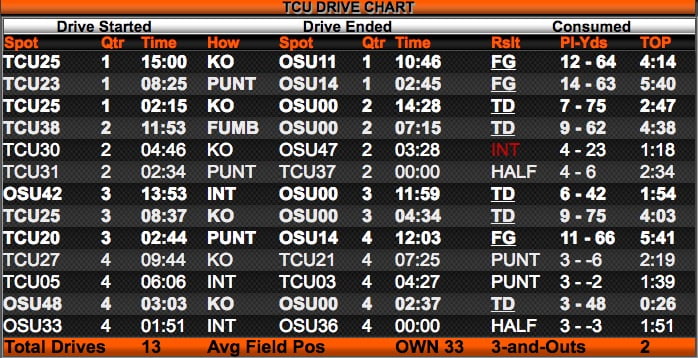
In its first eight real drives, TCU scored seven times and had one turnover. You’re not going to beat Texas Hindu University if that’s what you’re doing on defense. Look at those drives, too. Twelve plays to start, then 14, then seven, then nine. That’s 42 plays halfway through the second quarter. Oklahoma State could up its scholarship ratio to 60-25 in favor of the defense, and you still wouldn’t be able to keep enough guys fresh.
Pitt’s Pertinent Numbers
- Points per drive (offense): 3.38
- Points per drive (defense): 2.58
- Yards per play: 5.5
- Third-down conversions: 11/19 (58%)
- Average starting field position: own 33-yard line
- Red-zone scoring: 6/6
- Points off turnovers: 14
- Time of possession: 39:04
There is a lot going on here. The points off turnovers pops. So do the third-down conversions. So does the average starting field position as well as the time of possession. The bigger question than “how did OSU get torched at home by a 2-TD dog,” as I look at the numbers, is “how were they within one possession with three minutes left in the game?”
I was pretty critical of Kenny Hill in my 10 Thoughts, and I still don’t think he’s a very good college QB. But hats off to him for lighting up an OSU defense that seemed to be asking for somebody to light it up. OSU has to be better with its pass rush if they want to be competitive in the Big 12.
“They do a good job of spreading you out to create seams,” said defensive coordinator Glenn Spencer. “But it’s stuff we face against our guys all the time. I think you’re going to find probably that it was a missed tackle here or there. I know a couple times a D-lineman gets out of his gap. We didn’t play disciplined today.
“We as coaches, and me specifically, have to say, ‘hey we all own this, and we’re all going to get a chance next week to get a lot better.'”


Eric Morris’ Coaching Staff Has More in Common with Contenders than Big 12 Newcomers

Player Rating Superlatives: A Look at the Fastest, Strongest Cowboys in EA Sports’ College Football 27

Steve Lutz Releases Statement on Kashie Natt’s Eligibility Pursuit

Oklahoma State’s Offense Well Represented on Big 12 All-Portal Team

Daily Bullets (July 1): Caleb Hawkins a (Preseason) All-American

Daily Bullets (July 5): Some Predix for OSU Football

Daily Bullets (July 4): Can the Defense Match the Offense, Happy 250th, America!

Texas Tech, Colorado Headline Big 12’s Top Defensive Portal Additions This Offseason

The Reload Ep. 53: World Cup Grass, Big 12 Media Days Preview

Daily Bullets (July 3): The All-Portal Pokes
-
 Football4 days ago
Eric Morris’ Coaching Staff Has More in Common with Contenders than Big 12 Newcomers
-
 Football4 days ago
Player Rating Superlatives: A Look at the Fastest, Strongest Cowboys in EA Sports’ College Football 27
-
 Hoops4 days ago
Steve Lutz Releases Statement on Kashie Natt’s Eligibility Pursuit
-
 Football3 days ago
Oklahoma State’s Offense Well Represented on Big 12 All-Portal Team