
Football
Oklahoma State and the efficiency of scoring
OSU’s offense has been both all-encompassing and efficient over the last half decade.
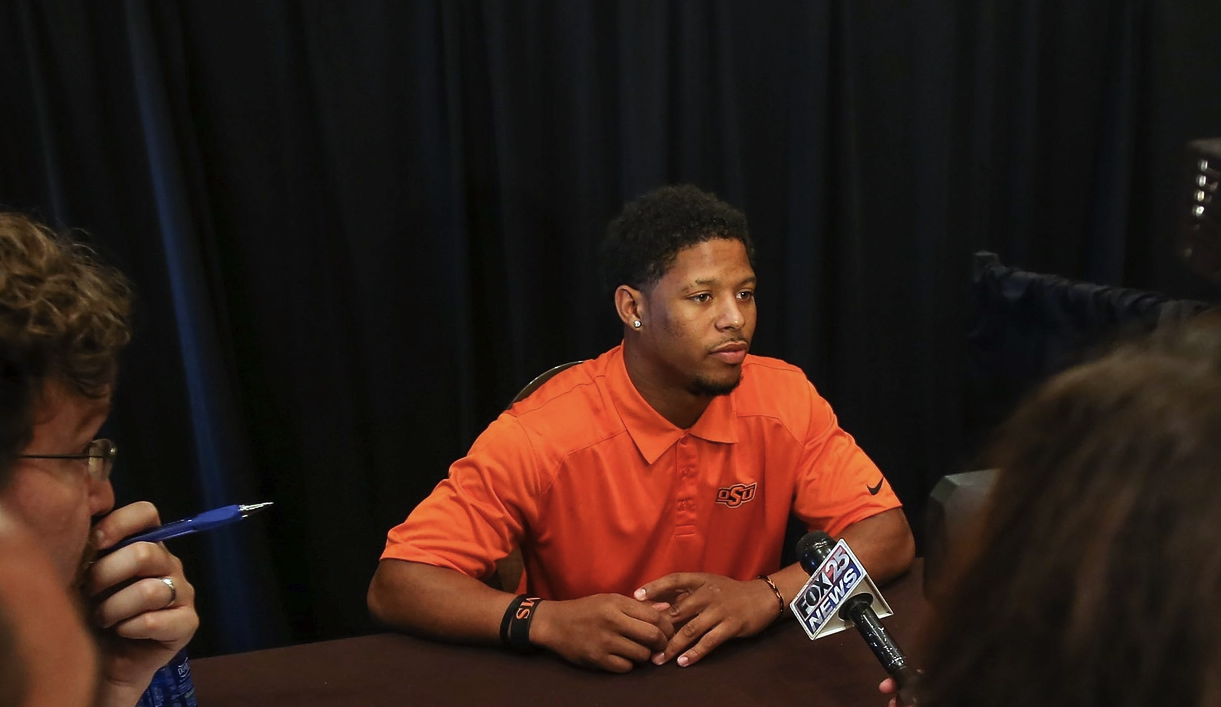
Photo Attribution: USATSI
We all know Oklahoma State’s offense has been sublime the last five years. It doesn’t take a football analytical genius to figure that out — all you have to do is flip on your television on a random Saturday and within 10-15 minutes you’re likely to see the Pokes put something in the end zone or through the uprights. That’s just the way things are in Stillwater these days.[1. It makes for a way-too-maligned defense and some interesting Internet debate, but that’s another post for another time.]
You might have some questions about the offense though.
Just how good have they been at scoring though? How prolific? We know they’ve probably been the best or near the best in the Big 12 in the last few years but what about nationally? Are they efficient or does the defense just suck so much that they get a ton of possessions and capitalize on some of them?
Well lucky for you, I have answers.
This chart is sorted by points per possession over the last five years. That’s total points divided by total possessions. So essentially, offensive efficiency. You can see OSU has been third best in all of college football in that timespan and the second best BCS team.
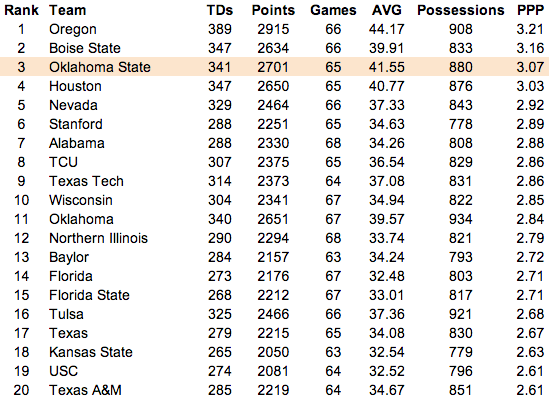
Of note:
• Only four teams in the country have averaged over three points per possession over the last five years. So when (if?) people to try to tell you OSU and Oregon are just volume offenses (that is, they score a lot because they have the ball a lot), it’s just not true.[1. Or “just ain’t true!”]
• Stanford, Alabama, and TCU (given their defensive prowess) have been very, VERY good the last five years. Nearly unbeatable.
• Also, Oregon, YIKES.
• Why does OU have so many more possessions than everyone else?
OK, so we know OSU scores a lot and does it efficiently, but are they consistent? You can hang 84 on Savannah State all day but are you scoring with any consistency throughout the season, or is everything up and down?
So I queried total games where teams score over 30 points since 2008. OSU, again, is at the top of the list.
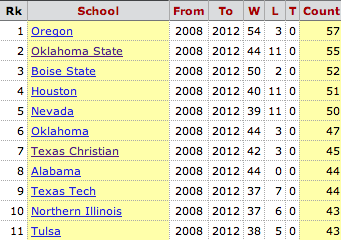
The part that stings, and this is where I’ll let you talk about the D, is that they’ve lost 11 of those. Or as many as Oregon, Boise, OU, and TCU combined.[1. Feels like it should be noted here that OSU is 27-4 in the same stretch when scoring 40+, Oregon is 45-1, Boise is 37-0, OU is 35-0, even Tech is 27-3.]
With a lot of teams you can kind of say “hey, they score 35-40 and that’s it, they’re winning.” Not the case with OSU — no lead is safe[1. How funny would this be as a marketing campaign for the 2013 season?] with our squad which is both fun (see chart that shows 2,701 points scored since 2008) and scary.
Check out our full 2013 OSU football preview here.


Caleb Hawkins Bigger, Strong, Faster Entering Sophomore Season

Drew Mestemaker Discusses the NFL Draft

Manning Passing Academy Gave Mestemaker More Confidence, Chance to Learn from Peyton, Eli

Offseason Hype Surrounds Cowboy Offense, but Cowboy Defenders Confident They’ll Be the Surprise Story This Fall

Eric Morris Took Early Steps to ‘Squash’ Natural Divisions within OSU’s Locker Room
Daily Bullets (July 13): Good News from MLB Draft for the Cowboys

OSU Baseball: Four Cowboys Drafted on Day 2 of MLB Draft

OSU Baseball: Kollin Ritchie Announces Return Following MLB Draft Selection

Daily Bullets (July 12): Several Cowboys Await Day 2 of MLB Draft

OSU Baseball: San Diego Padres Draft Alex Conover in Round 4
-
 Football5 days ago
Caleb Hawkins Bigger, Strong, Faster Entering Sophomore Season
-
 Football5 days ago
Drew Mestemaker Discusses the NFL Draft
-
 Football4 days ago
Manning Passing Academy Gave Mestemaker More Confidence, Chance to Learn from Peyton, Eli
-
 Football4 days ago
Offseason Hype Surrounds Cowboy Offense, but Cowboy Defenders Confident They’ll Be the Surprise Story This Fall