
Hoops
Oklahoma State Had The Best Offense (and Worst Defense) In The Big 12
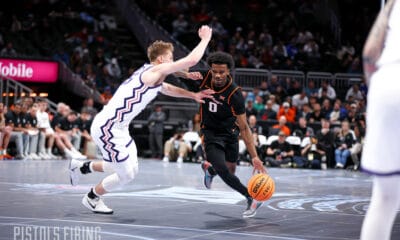
I dubbed Oklahoma State hoops the Texas Tech football of college basketball this year: elite (like, elite) on offense and an absolute sieve on defense, one of the worst in Big 12 history.
Since 2002, only Baylor (2005, 2005 and 2007) and TCU in 2014 have had a worst conference-only defensive efficiency than Oklahoma State’s 113.8 this year. Those other four teams went a combined 8-58 (not a typo) in conference play.
Defensive efficiency means how many points you give up per 100 possessions, or when divided by 100 how many points you give up per possession. OSU gave up 1.138 points per possession 2017 which is pretty easily the worst in recent OSU history.
However, there is good news. It also posted probably the best offensive season in school history. It will end up breaking the school record in points per game and its adjusted offensive efficiency of 125.1 (or 1.251 points per possession) is currently No. 1 in the country.
These efficiency numbers were created to take tempo out of the equation when measuring teams. It’s the same thing we do with points per possession in football. Alabama’s defense is not better because it allows nine points a game and OSU allows 30. Alabama’s defense is better because it allows 1 point per possession and OSU allows 3.
Offense does not win championships, though. Last year’s Final Four teams (OU, Villanova, North Carolina and Syracuse) were all top 21 in the nation in country in defensive efficiency. OSU is currently No. 123.
Let’s look at the conference profiles of each Big 12 team before we delve a little further into Oklahoma State’s recent history. These are conference-only numbers for 2017.
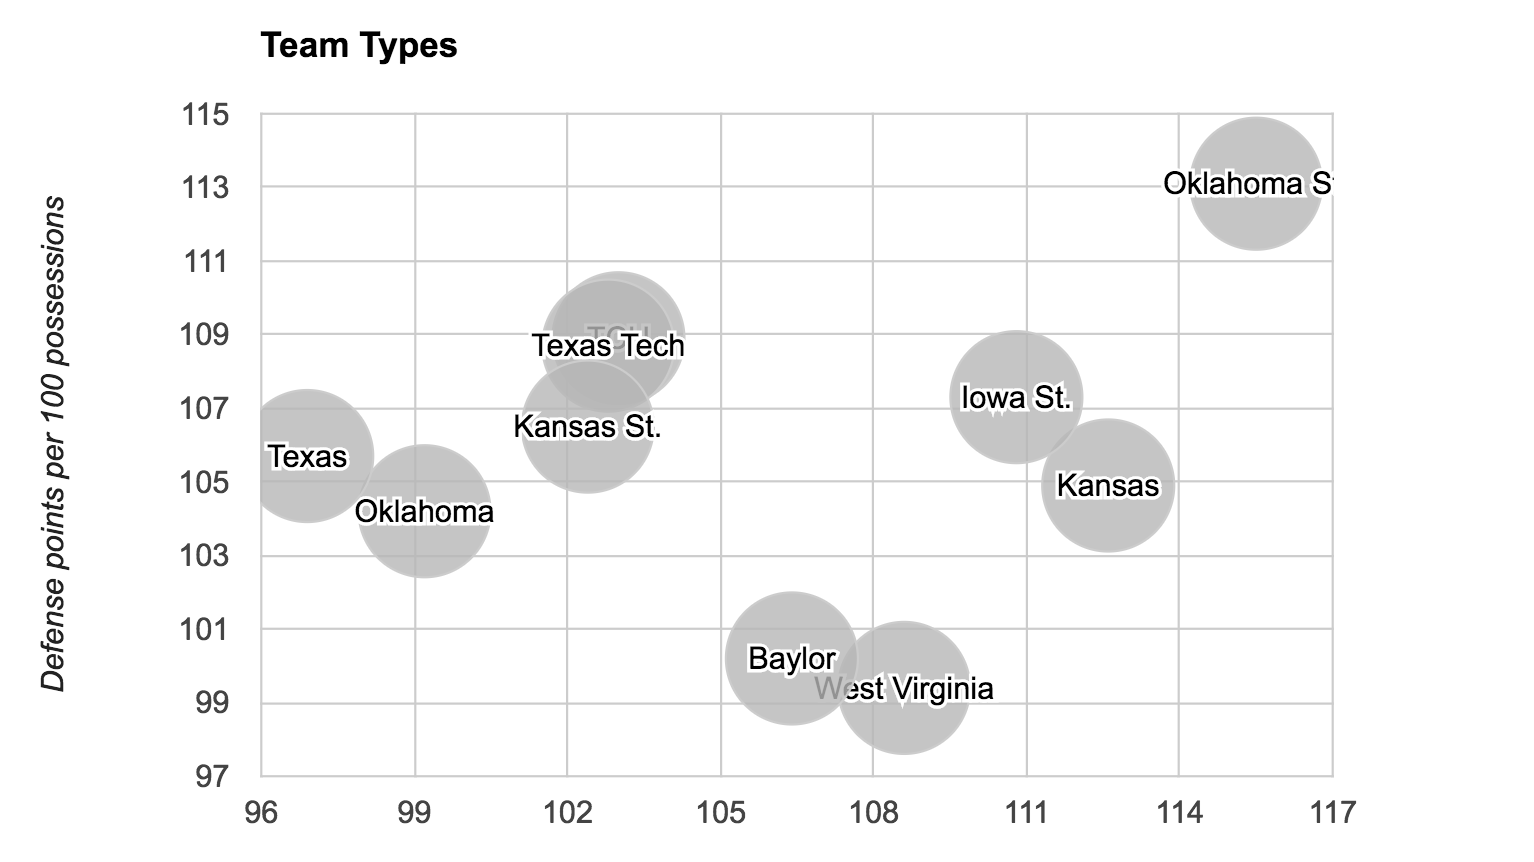
You want to be in the bottom right of this graph. Great offense, great defense. Top right is great offense, bad defense. Bottom left is great defense, terrible offense. And top left is where your coach gets fired.
Again these are conference-only stats so OSU’s offensive efficiency of 115.5 was not quite as good as its overall efficiency of 125.1. Still, it was tops in the Big 12 by three points over KU.
Speaking of KU, it’s no surprise they are closest to the bottom right on this graph. They have the profile of a Final Four team (fifth in offense in the country, 26th in defense). It’s also interesting to me that the two more effective defensive teams (Baylor and WVU) finished ahead of the two more effective offensive teams (ISU and OSU).
Here is a graph charting the last 16 Oklahoma State teams.

Like I said, top left gets your coach fired.
It’s almost laughable how good this OSU team was on offense this year. Their next closest competitor was the 2005 team which finished No. 4 in the country that year in adjusted offense.
The difference from the great teams of the last decade and a half and the good ones, though, is defense. Look at that 2004 team. Whoo boy, put that sucker in my veins. Seventh in the country on offense, ninth on defense. That’s a Final Four profile. The 2013 squad with Marcus Smart was pretty dang good as well.
So while Oklahoma State was impressive in Year 1 under Underwood, and fun as hell on offense, it still has a long way to go defensively to become the type of team that contends for conference and national championships.


What Vegas Odds Say about Oklahoma State’s 2026 Football Schedule

‘Country Strong’: After Breaking Out at Last Season’s Regional, Kollin Ritchie Enters This Postseason as the Cowboys’ Star

Where Oklahoma State’s Basketball Transfers Ended Up

Could Congress Force Bedlam Football to Return?

OSU Wrestling: Cowboys Sending Big Group to Ohio for U20 World Team Trials, U23 Nationals

Daily Bullets (May 30): Cowboys Put Two on U20 World Team, Examining a 24-Team Playoff

Robideau, Ross Win U20 World Team Trials to Earn Spot at U20 World Championships

OSU Baseball: Cowboys Drop Tuscaloosa Regional Opener to USC-Upstate

What 24 Team Playoff Would Mean for the Big 12, OSU

Daily Bullets (May 29): Tuscaloosa Regional, NCAA Golf Championships Start Today
-
 Football5 days ago
What Vegas Odds Say about Oklahoma State’s 2026 Football Schedule
-
 Baseball4 days ago
‘Country Strong’: After Breaking Out at Last Season’s Regional, Kollin Ritchie Enters This Postseason as the Cowboys’ Star
-
 Hoops1 day ago
Where Oklahoma State’s Basketball Transfers Ended Up
-
 Football3 days ago
Could Congress Force Bedlam Football to Return?