
Football
Oklahoma State Maintains Elite Points Per Drive Rate on Offense
Another week, another blank space for BCF Toys in the points per drive category. Where are we at in society? I would love to look at how Oklahoma State ranks nationally in points per drive, but for now all we have is the OSU-specific data. Let’s take a look at how the Pokes are faring offensively in what I think is the most important stat you can look at.
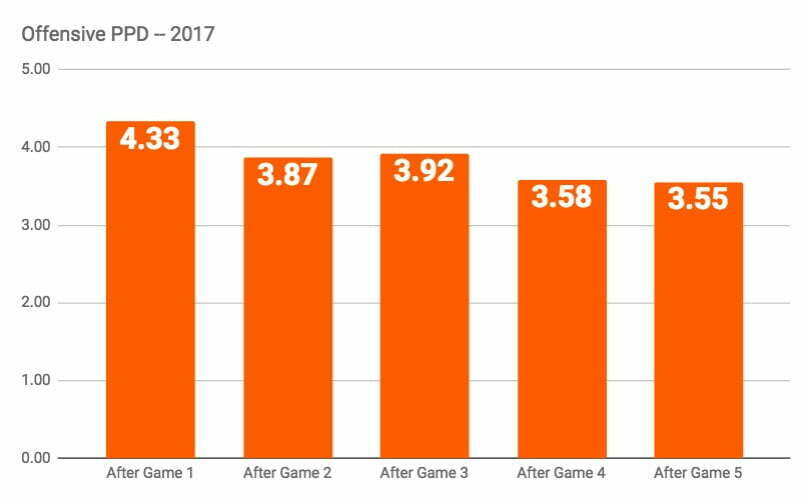
Offensive PPD
After that mammoth game against Tulsa, OSU has fallen off a bit. But maybe not as much as you would think. The school record for PPD (as far back as I can tell) is 3.42 in 2011. That was adjusted for garbage time and end-of-half drives, and my data is not. So likely that 3.55 number you see nearly halfway through the year is much higher.
One interesting point here is that OSU isn’t getting as many drives as it has historically. Through five games in 2011 it already had 72 drives. This year it has just 60. A whole game’s worth of drives fewer. Anyway, here is where OSU’s PPD number stood after each game. So it was 4.33 for the season after Game 1 and 3.92 for the season after Game 3. It is now 3.55 for the season, and I would expect it to remain around there for the duration.
Defensive PPD
Last year Oklahoma State’s defensive points per drive number was 2.09 which was good for 54th in the country. Again, that did not include garbage time and end-of-half numbers which means that my numbers this year (which do include those two things) actually probably make this defense look better than it has actually been thus far.
Here’s a look.
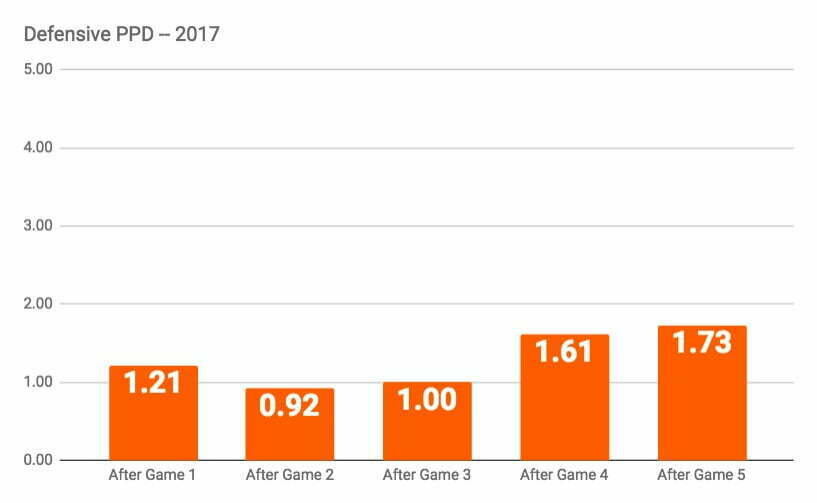
Still, 1.73 is not terrible. Last year San Diego State was at 1.72, and it was the No. 23 defense in the country. The problem is that Oklahoma State is unlikely to maintain 1.73 as Big 12 play wears on and it faces some of the best offenses in the country.
Counterpoint: Texas Tech might be a top 20 offense, and OSU held it to just 2.3 points per drive.
Lastly, let’s look at OSU’s stop rate.
Stop Rate
A team’s stop rate is simply what percentage of drives a team keeps its opponent from scoring. Oklahoma State does that on 70 percent of drives thus far (doesn’t feel like it, does it?!) As with the other numbers, this one will tumble a bit as the season wears on.
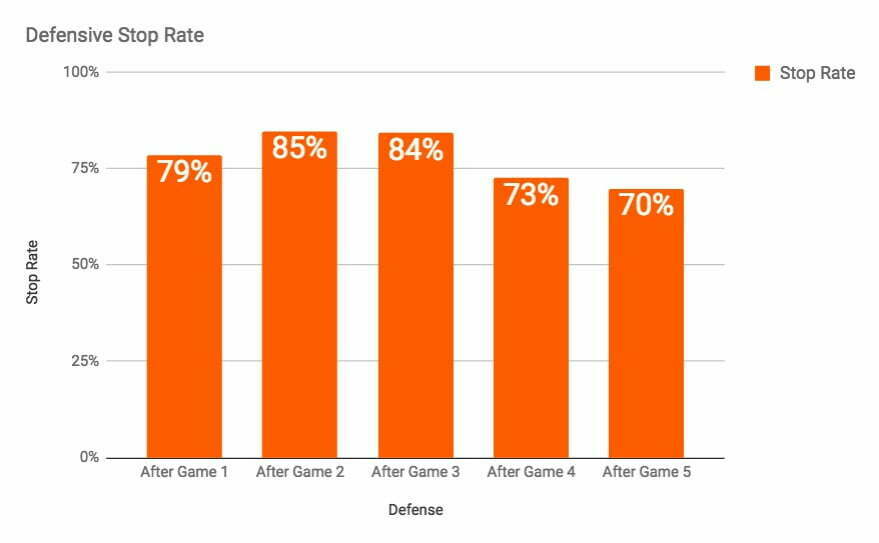
According to Max Olson of The Athletic ($$), that 70 percent number is around top 50 in the country. His numbers are a little different than mine because he counts pick-sixes, for example, against a defense. So he has OSU at 1.85 points per drive on defense because he counts the pick-six Rudolph threw at Tech against the defense. I don’t really blame him for not wanting to parse through all the data, but it dilutes the numbers a little bit.
All that to say, Oklahoma State has a record-setting offense right now (even for recent Oklahoma State history) and a defense that might not be as bad as it has felt at times (i.e. third downs vs. Tulsa, entire game vs. TCU). Lot of ball left, though, and it will be interesting to see where these numbers go from here.


Oklahoma State Running Back Caleb Hawkins Named Walter Camp Preseason All-American

Eric Morris’ Coaching Staff Has More in Common with Contenders than Big 12 Newcomers

Player Rating Superlatives: A Look at the Fastest, Strongest Cowboys in EA Sports’ College Football 27

Steve Lutz Releases Statement on Kashie Natt’s Eligibility Pursuit

Oklahoma State’s Offense Well Represented on Big 12 All-Portal Team

Daily Bullets (July 5): Some Predix for OSU Football

Daily Bullets (July 4): Can the Defense Match the Offense, Happy 250th, America!

Texas Tech, Colorado Headline Big 12’s Top Defensive Portal Additions This Offseason

The Reload Ep. 53: World Cup Grass, Big 12 Media Days Preview

Daily Bullets (July 3): The All-Portal Pokes
-
 Football5 days ago
Oklahoma State Running Back Caleb Hawkins Named Walter Camp Preseason All-American
-
 Football4 days ago
Eric Morris’ Coaching Staff Has More in Common with Contenders than Big 12 Newcomers
-
 Football4 days ago
Player Rating Superlatives: A Look at the Fastest, Strongest Cowboys in EA Sports’ College Football 27
-
 Hoops4 days ago
Steve Lutz Releases Statement on Kashie Natt’s Eligibility Pursuit