
Hoops
OSU Basketball Attendance up 44% from 2016
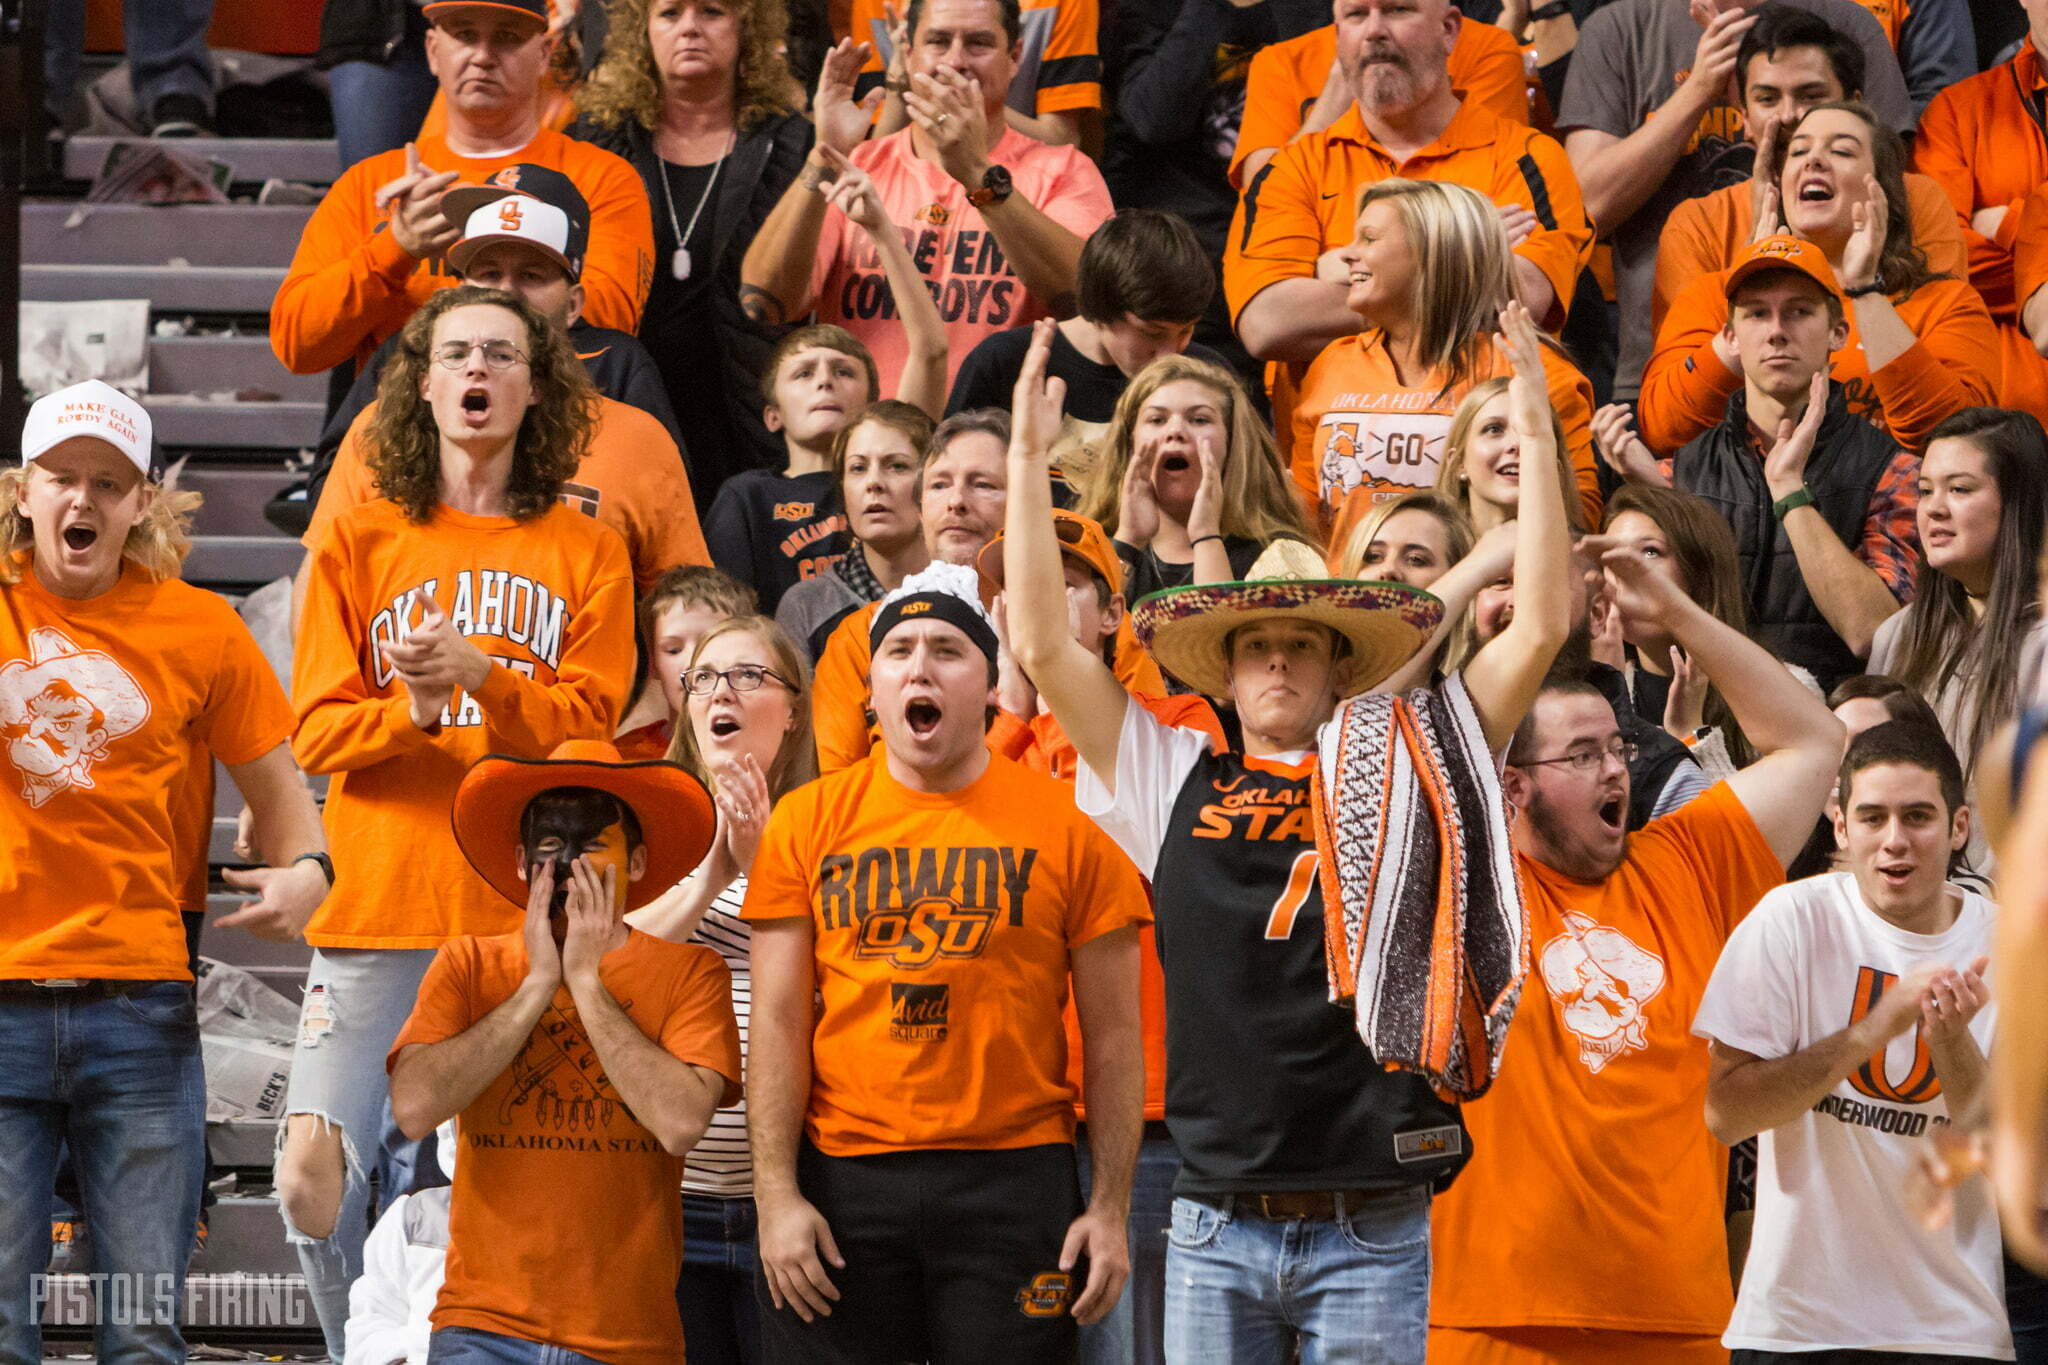
While attendance for college basketball on the whole dipped for a third-straight season, OSU was not among that majority.
In attendance figures for the 2016-17 season released by the NCAA on Tuesday, OSU’s attendance was up — way up — from attendance numbers from the previous season. In fact, OSU was No. 3 in the NCAA among schools with the biggest increase for average attendance with a 44 percent jump from 2015-16.
| School | 2017 Avg. | 2016 Avg. | Increase YOY | Change in Avg. |
|---|---|---|---|---|
| 1. Missouri | 9,930 | 6,295 | 57% | 3,635 |
| 2. UCLA | 11,182 | 8,073 | 38% | 3,109 |
| 3. Oklahoma State | 8,436 | 5,857 | 44% | 2,579 |
| 4. Oregon | 9,894 | 7,466 | 32% | 2,4285 |
| 5. Nevada | 8,922 | 6,554 | 36% | 2,368 |
| 6. Arkansas State | 3,383 | 1,448 | 133% | 1,935 |
| 7. Villanova | 9,772 | 8,119 | 20% | 1,653 |
| 8. St. John’s (NY) | 8,448 | 6,944 | 21% | 1,504 |
| 9. Creighton | 17,412 | 15,941 | 9% | 1,471 |
| 10. South Carolina | 13,395 | 11,995 | 11% | 1,400 |
There was obviously a pretty low level of optimism around the program in Travis Ford’s final days, which might have been the final nail in his OSU career coffin. So to jump up on average of an extra 2,579 people per game from one year to the next is truly stunning, and a testament to the fan interest Brad Underwood restored in his brief tenure.
Although those numbers are impressive by recent OSU standards, they still fall pretty low on the totem pole in the Big 12 in average attendance behind every team in the league except Baylor and TCU.
| School | 2017 Avg. |
|---|---|
| 1. Kansas | 16,395 |
| 2. Iowa State | 14,275 |
| 3. Kansas State | 11,477 |
| 4. West Virginia | 11,374 |
| 5. Texas | 10,490 |
| 6. Oklahoma | 9,296 |
| 7. Texas Tech | 9,026 |
| 8. Oklahoma State | 8,436 |
| 9. Baylor | 6,811 |
| 10. TCU | 6,126 |
With a coaching change this offseason prompted by Underwood’s abrupt departure to Illinois, I’d be a little bit surprised to see the attendance increase when these numbers come out this time next year. But if Boynton can maintain the same level of momentum as Underwood, or even capture a portion of the excitement Underwood generated last year, OSU could very well climb its way into the middle-of-the-pack in the conference in average attendance per game.
In average attendance on a league-by-league basis, the Big 12 ranked fourth behind the Big Ten, ACC and SEC, and slightly ahead of the Big East.
| School | 2017 Total | 2017 Avg. |
|---|---|---|
| Big Ten | 3,119,823 | 12,235 |
| ACC | 3,005,685 | 11,257 |
| SEC | 2,625,959 | 11,080 |
| Big 12 | 1,856,017 | 10,427 |
| Big East | 1,702,400 | 10,014 |
| Pac-12 | 1,691,216 | 8,170 |
Note: The percentage increase of 44% from 2016 was previously reported as 69% but has been updated.


OSU Softball: Mississippi State Transfer Pitcher Delainey Everett Commits to Oklahoma State

Four-Star Linebacker Israel Hammons Commits to Oklahoma State

OSU Baseball: Cowboys Land Washington Pitcher Noah Kenney, Texas Tech Transfer Will Jordan

Former OSU Offensive Line Commit Chase Clark Flips to Purdue

Oklahoma State Quarterback Drew Mestemaker to Attend Manning Passing Academy

Daily Bullets (June 23): Mike Boynton (Interim) Head Coaching Again

Audi Crooks Decided to Become a Cowgirl After Jacie Hoyt Confronted Her with Lowlight Reel

Cowgirl Hoops: 6-foot-7 European Center Mojca Jelenc Signs with Oklahoma State

Report: Mike Boynton to Become Michigan’s Interim Coach

Daily Bullets (June 22): Cowboy Wins a Major
-
 Softball3 days ago
OSU Softball: Mississippi State Transfer Pitcher Delainey Everett Commits to Oklahoma State
-
 Football3 days ago
Four-Star Linebacker Israel Hammons Commits to Oklahoma State
-
 Baseball3 days ago
OSU Baseball: Cowboys Land Washington Pitcher Noah Kenney, Texas Tech Transfer Will Jordan
-
 Football5 days ago
Former OSU Offensive Line Commit Chase Clark Flips to Purdue