
Football
Which Big 12 Offense Was Best?
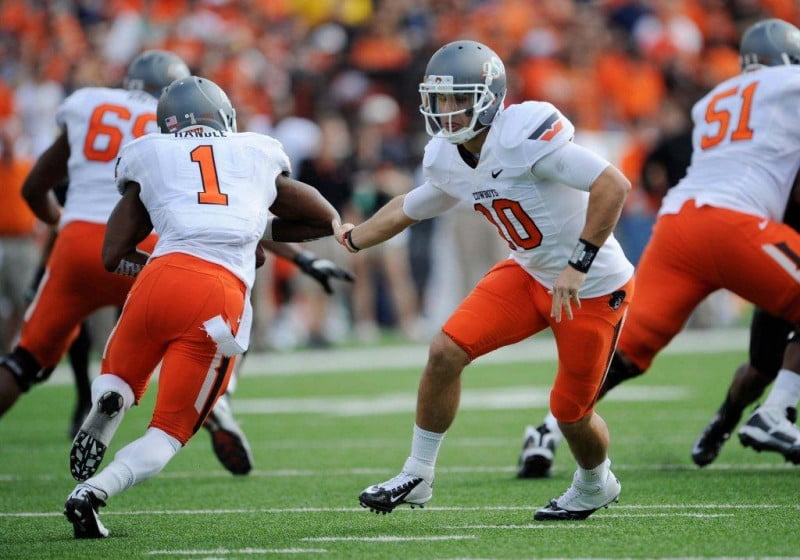
Photo Attribution: US Presswire
David Ubben posed the question yesterday on his Big 12 blog. There are a number of ways to look at this but the title of “best offense in the Big 12” definitely belongs to one of the following five schools: Baylor, KSU, OSU, OU, and WVU.
First, let’s rid ourselves of the archaic points per game metric when looking at best offenses. Oklahoma State does not necessarily have a better offense than Alabama because they score 20 or 30 more points per game. That’s dumb and outdated.
The true measure of a great offense is how efficient you are when you get the ball.
For example, if you get 1,000 possessions in a season and score 200 TDs but punt 800 times, you’d set the NCAA record for points scored, but you were ridiculously inefficient in doing it. And since other teams get the same amount of possessions (roughly) as you, you probably went 0-12. Plus, your punter needs a leg replacement and those are expensive.
So to answer the question about which offense was most efficient, let’s dig into the numbers.
[table id=72 /]
Some notes on this table…
% scored is what percentage of your offensive drives did you score points (FG or TD) on.
% given up is what percentage of your offensive drives did you give the ball back to the other team without scoring on[1. These aren’t supposed to add up to 100% because we aren’t accounting for end of half or end of game drives, I just threw them out].
Kansas State’s offense received the ball 141 times (fewest in the conference) — and only gave it back without scoring on 38% of their possessions. This was the best mark in the country. Next best in the Big 12 was OSU at 43%, next best nationally was La Tech at 41%.
This is absurd, and really sheds light on the fact that KSU only had nine (!) turnovers all year. Nine! I think OSU had nine in the Arizona game!
Also, on 52% of those 141 possessions, the Wildcats scored (again, the other 10% were end of the half or end of game drives). Only five other teams in the country had a mark over 50% (OSU, Baylor, Bama, A&M, and La Tech).
Their points per drive mark (a model of efficiency) was 2.77. So if you gave KSU 13 possessions in any given game (the national average) you could expect them to score 36.01 points. Combine that with only coughing it up nine times all year and…well….you see why they won the Big 12.
Baylor was nearly as efficient at 2.75 points per drive, even though they turned it over and gave it back a lot more than K-State did. The reason was that they scored 65 (!!) touchdowns and had one of the best TD/FG ratios in the conference (4 TD for every 1 FG). There’s a lot of room to make up for inefficiencies by putting the ball in the endzone.
On the flip side, OSU scored more often than any team in the league (88 total scores) but they couldn’t post TDs. If they score TDs on just 7-8 of their field goals then they’re right up there on points per drive with Baylor and KSU.
WVU and OU gave it back to their opponents without scoring far too often to be considered the conference’s best offense.
So here’s how I would rank them based on efficiency:
1. Kansas State
2. Baylor
3. Oklahoma State
4. WVU
5. OU
And here’s how you guys ranked them on SportsNation:
1. Baylor
2. West Virginia
3. Kansas State
4. Oklahoma State
5. Oklahoma
I don’t have a huge problem with WVU over OSU (because of the Savannah State game) but man, I have a hard time putting Dana’s squad ahead of Kansas State which, just like its coach, was an absolute model of efficiency in 2012.


Report: Big 12 ADs Have ‘Serious’ Talks about Not Playing Texas Tech Following Sorsby Ruling

Sorsby’s Temporary Injunction the Latest Example of How Broken College Athletics Is

Parsa Fallah, Kashie Natt Seeking Eligibility Waivers to Play at Oklahoma State Next Season

A Look at Four of the Prospects Oklahoma State Is Set to Host This Week

‘Not Enough to Make the NCAA Tournament’: Steve Lutz Is Aiming High This Season

Daily Bullets (June 13): Oklahoma AG Speaks out on Texas Tech Case, Steve Lutz and Profile Service

Oklahoma Attorney General Pushes for Big 12 to Suspend Brendan Sorsby, Offers Legal Support

How Oklahoma State’s Best Defenders Stack Up with Big 12
Pistols Firing Podcast Ep. 707: Sorsby Saga and Remembering Bob Simmons

Daily Bullets (June 12): Hoops Conference Opponents Announced
-
 Football5 days ago
Report: Big 12 ADs Have ‘Serious’ Talks about Not Playing Texas Tech Following Sorsby Ruling
-
 Football5 days ago
Sorsby’s Temporary Injunction the Latest Example of How Broken College Athletics Is
-
 Hoops4 days ago
Parsa Fallah, Kashie Natt Seeking Eligibility Waivers to Play at Oklahoma State Next Season
-
 Football4 days ago
A Look at Four of the Prospects Oklahoma State Is Set to Host This Week