
Football
Hot Take of the Day: Mason Rudolph was Better than Brandon Weeden
Look at the numbers and get back to me.
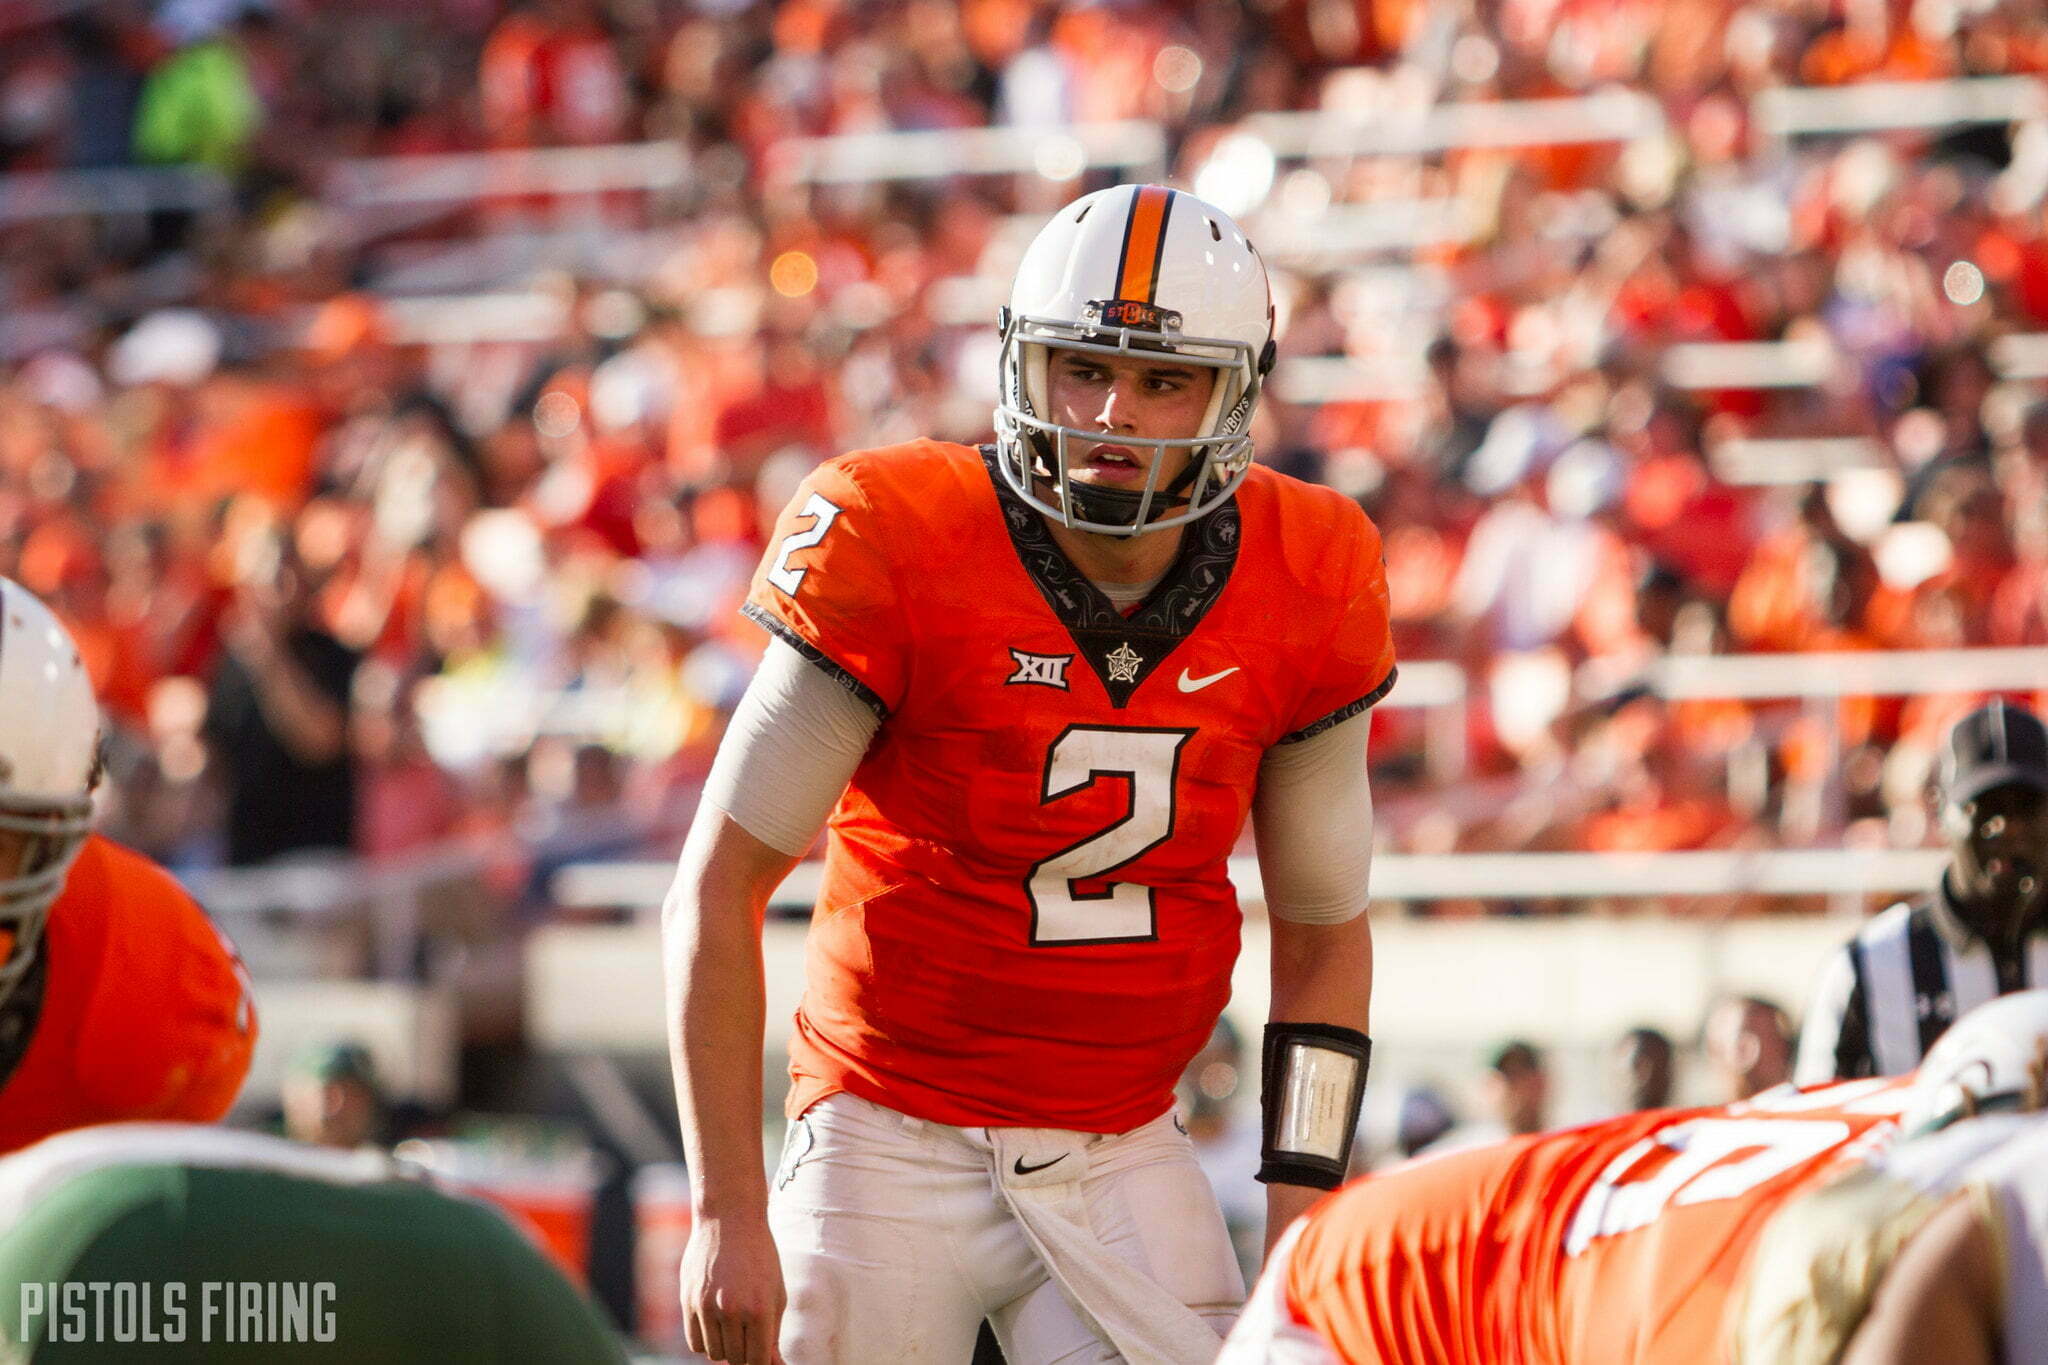
I don’t often get too controversial, but I’m being told that putting Mason Rudolph ahead of Brandon Weeden as the best quarterback in Oklahoma State history has quite a bit of spice to it.
I could base this off hypothetical, saying if you plop Rudolph into the 2011 offense, records would be set that might never get touched. I could point out that Weeden had better offensive line play and a more consistent running game to help him. But instead I’ll point to some stone-cold facts.
So if you could bite your tongue for just a moment, I’ll set my case as to why Rudolph > Weeden.
I’d also like to preface this with the fact that Weeden was awesome. I don’t want any of this to bedowngrade his career as the second-best QB in OSU history. Ed. note: I do not approve this message. (KP)
First, let’s take a look at some career numbers side by side:
| Weeden | Rudolph | |
|---|---|---|
| Pass Attempts | 1,103 | 1,447 |
| Completions | 767 | 915 |
| Yards | 9,260 | 13,618 |
| Touchdowns | 75 | 92 |
| Interceptions | 27 | 26 |
Now, I can hear you hollering, “YEAH, BUT RUDOLPH PLAYED IN 39 GAMES AND WEEDEN ONLY PLAYED IN 30!”
And that’s true, so let’s look at some deeper percentages.
| Weeden | Rudolph | |
|---|---|---|
| Completion Percentage | 69.5 | 63.2 |
| Pass Efficiency | 157.6 | 159.7 |
| Yards Per Attempt | 8.4 | 9.4 |
| Yards Per Completion | 12.1 | 14.9 |
| Yards Per Game | 298.7 | 324.2 |
| Total Offense Per Game | 293.9 | 324.9 |
| Total Offense Per Play | 7.98 | 8.16 |
Now I imagine the argument shifts to, “OK, SO? WEEDEN’S 2011 SEASON IS WAY BETTER THAN ANYTHING RUDOLPH EVEN DONE DID!”
Well then let’s stack up Weeden’s senior season vs. Rudolph’s senior season.
| Weeden | Rudolph | |
|---|---|---|
| Attempts | 565 | 489 |
| Completions | 409 | 318 |
| Yards | 4,727 | 4,904 |
| Touchdowns | 37 | 37 |
| Interceptions | 13 | 9 |
| Completion Percentage | 72.4 | 63.4 |
| Pass Efficiency | 159.7 | 170.6 |
| Yards Per Attempt | 8.4 | 10 |
| Yards Per Completion | 10.4 | 15.4 |
| Yards Per Game | 363.6 | 377.2 |
| Total TDs | 38 | 47 |
| Total Offense Per Game | 355.8 | 379.9 |
| Total Offense Per Play | 7.95 | 8.98 |
So what that’s telling us is that Rudolph threw for more yards, the same amount of touchdowns despite throwing the ball 91 fewer times. He also had fewer interceptions. And Rudolph also ran for 10 TDs to Weeden’s one.
Presented with these facts, I’m sure some of you are really boiling now. “YOU JUST DON’T GET IT. YEAH, NUMBERS ARE COOL AND ALL, BUT WEEDEN WON GAMES AND RUDOLPH DIDN’T.”
Yes, Brandon Weeden won a BCS Bowl game and a Big 12 title while Rudolph didn’t. That’s also a fact. Another fact is that Weeden went 23-3 as a starter and Rudolph went 32-8.
And I said above I won’t make the argument of putting Rudolph on the 2011 team, but I will point out that in Weeden’s junior and senior seasons (2010 and 2011), OSU allowed a combined 22 sacks.
In Rudolph’s junior and senior seasons (2016 and 2017) OSU allowed a combined 56 sacks. Just a measly 34-sack difference.
So, there’s my argument laid out with statistical evidence to support it. And, like I said, both QBs are all-time greats at OSU, but if in some weird post-pandemic world I am the captain of some schoolyard team with the option of choosing either, give me Rudolph and go long.


Oklahoma State Wins All-Sports Bedlam for Sixth Time in Last Seven Years

Report: Kashie Natt Files Lawsuit Against NCAA Seeking Eligibility

Viktor Hovland Outlasts Scottie Scheffler to Win Traveler’s Championship

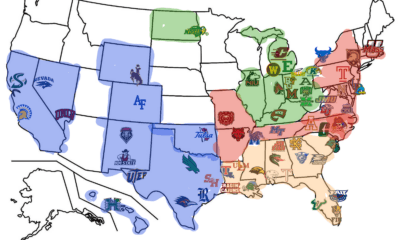
Fixing the Group of Five: A Fun Idea to Bring Promotion-Relegation to College Football

2025–26 Oklahoma State Final Grades: Cowboy Golf, Track End the Year on High Notes

Oklahoma State’s Offense Well Represented on Big 12 All-Portal Team

Marcus Smart Signs with Houston Rockets

Daily Bullets (July 2): Rating the Cowboys Roster

Steve Lutz Releases Statement on Kashie Natt’s Eligibility Pursuit

Player Rating Superlatives: A Look at the Fastest, Strongest Cowboys in EA Sports’ College Football 27
-
 Baseball4 days ago
Oklahoma State Wins All-Sports Bedlam for Sixth Time in Last Seven Years
-
 Hoops3 days ago
Report: Kashie Natt Files Lawsuit Against NCAA Seeking Eligibility
-
 Golf4 days ago
Viktor Hovland Outlasts Scottie Scheffler to Win Traveler’s Championship
-
 Football3 days ago
Fixing the Group of Five: A Fun Idea to Bring Promotion-Relegation to College Football