
Hoops
A look at offensive and defensive efficiency in the West Region
How does Oklahoma State stand up against Oregon? What about Wisconsin and Arizona?
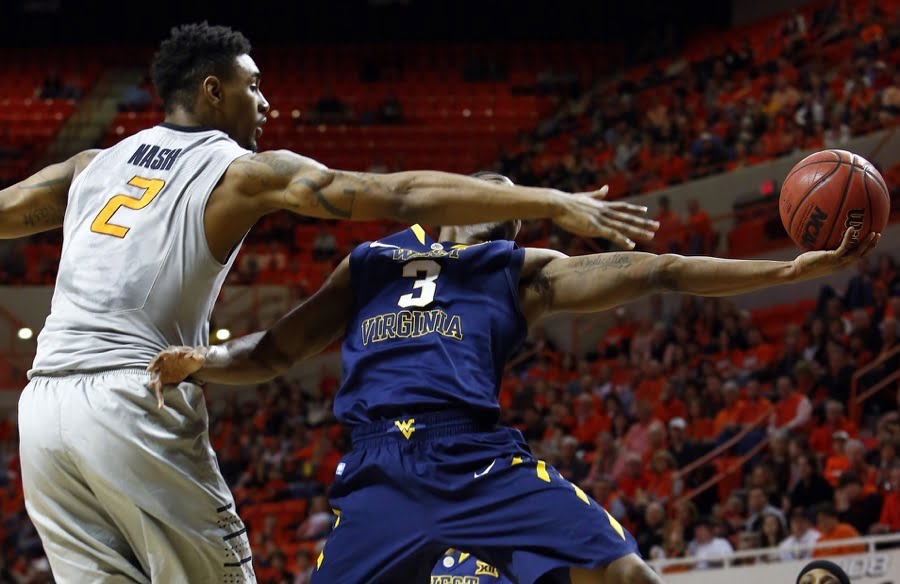
Le’Bryan Nash plays defense on Juwan Staten. (USATSI)
I am straight up stealing this from OKC Dave. He did it a couple of years ago, and reader Ben Oller recently reminded me about it so I decided to run it back on the 2015 West Region.
Here’s a look at a scatter plot of all the teams as they perform in terms of adjusted offensive and defensive efficiency.
Adjusted efficiency is simply the number of points a team would score or give up per 100 possessions against an average D1 team.
You want to be in the bottom right of this chart. You do not want to be in the top right.[1. Kentucky, by the way, would not even be on this chart. They are 120 in offensive efficiency and 83.6 (!!) in defensive efficiency. Here’s the link to the data.]
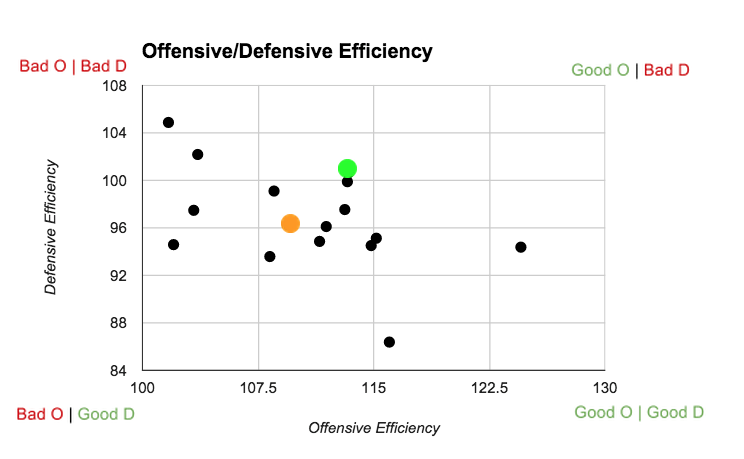
Oklahoma State is about as middle of the road as teams come in the West Region which its No. 9 seed indicates. Oregon is a little better on offense than most teams and a little worse on defense.
Those two outliers on the bottom right are Wisconsin (far right) and Arizona (bottom middle). Their regional final game is going to be a war. The team on the far upper left is Texas Southern. Arizona is going to do unholy things to them in the first round.
As Mark Cooper pointed out on Twitter today, the struggles we’ve seen from OSU are recent. For the first half of the Big 12 season they were really good on D.
A deep dive into #OKState's late-season defensive issues, which extend beyond rebounding: http://t.co/1wu9D8lSqB pic.twitter.com/9a3HN8M74V
— Mark Cooper (@mark_cooperjr) March 18, 2015
Still, defense wins championships first round games and if OSU can muster enough of it against Oregon, it can absolutely move on to get impaled by a Wisconsin team that is one of the best and most balanced in the entire bracket.


Parsa Fallah, Kashie Natt Seeking Eligibility Waivers to Play at Oklahoma State Next Season

A Look at Four of the Prospects Oklahoma State Is Set to Host This Week

‘Not Enough to Make the NCAA Tournament’: Steve Lutz Is Aiming High This Season

Oklahoma State’s Top 5 Wins of the Bob Simmons Era

Three-Star Texas Wide Receiver Ake O’Neal Commits to Oklahoma State

Daily Bullets (June 14): Kenny Gajewski, Josh Holliday Each Land Big 12 Transfers on Saturday

OSU Baseball: Utah Transfer Pitcher Kaden Soder Commits to Oklahoma State

OSU Softball: Houston Two-Way Transfer Madison Hartley Commits to Oklahoma State

OSU Softball: Utah Transfer Catcher Kennedy Proctor Commits to Oklahoma State

Daily Bullets (June 13): Oklahoma AG Speaks out on Texas Tech Case, Steve Lutz and Profile Service
-
 Hoops5 days ago
Parsa Fallah, Kashie Natt Seeking Eligibility Waivers to Play at Oklahoma State Next Season
-
 Football5 days ago
A Look at Four of the Prospects Oklahoma State Is Set to Host This Week
-
 Hoops5 days ago
‘Not Enough to Make the NCAA Tournament’: Steve Lutz Is Aiming High This Season
-
 Football4 days ago
Oklahoma State’s Top 5 Wins of the Bob Simmons Era