
Football
Drive Charts: Oklahoma State Dominated Kansas State In the Fourth Quarter
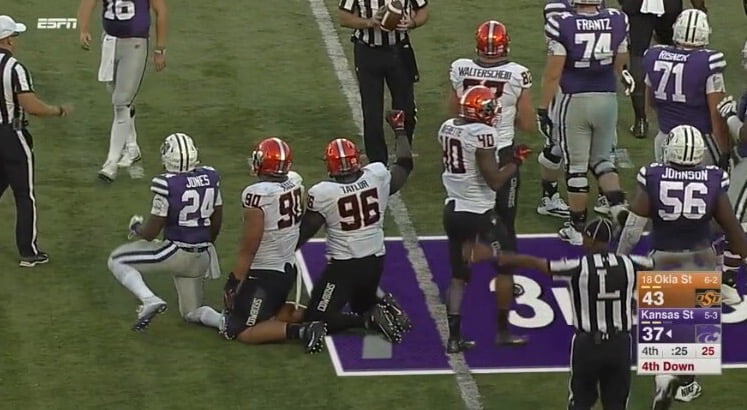
Oklahoma State and Kansas State played a hell of a football game on Saturday afternoon in Manhattan. It was a game that left Glenn Spencer saying, “How did we win that game?” If you simply look at the drive charts, you will be wondering the same thing. Let’s dive in.
OSU Drive Chart
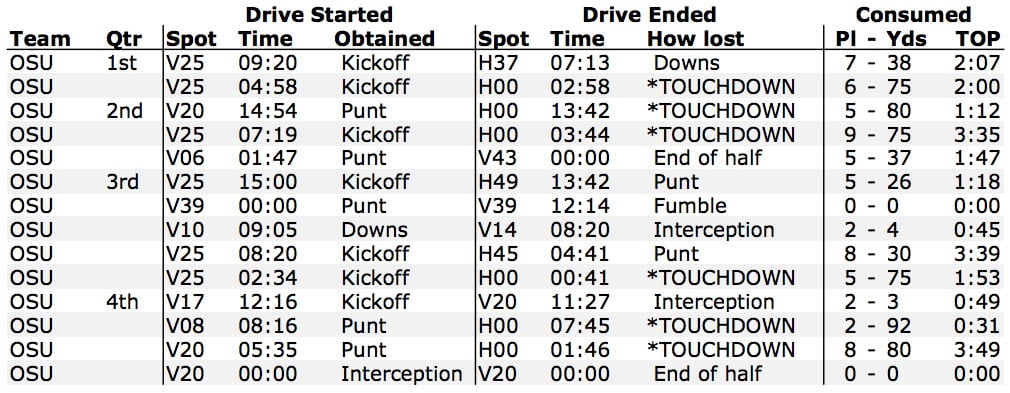
Oklahoma State started off in the first half but went four straight drives in the middle without a point and had two punts and two turnovers. Then it ended the way it began — with a batch of TDs.
- Yards per play: 10.0
- Points per drive (offense): 3.58
- Points per drive (defense): 2.50
- Points off turnovers: 0
- Average starting field position: Own 19
One area in which Oklahoma State has really thrived this year is the field position game. This was not the case on Saturday as Kansas State started a full 14 yards better than the Pokes. It was not a banner day for either defense although OSU held KSU to around its average (2.44 PPD).
Note: I had this incorrect in my 10 Thoughts as I forgot about the pick-six which obviously doesn’t go to the offense.
Oklahoma State went 247 yards in its final three scoring drives in just 15 plays or 16.5 yards per play. That is strong. That is finishing like Rob Glass is your conditioning coach.
“We stress never showing any fear, never showing any fatigue, and never showing any frustration in our organization,” said Gundy after the game. “Two of those came to light by not showing frustration, from the coaches or players, we are not allowed to show frustration. I thought the fatigue in the latter part of the game that we were in better condition and more fresh than they [Kansas State] were today.”
Kansas State Drive Chart
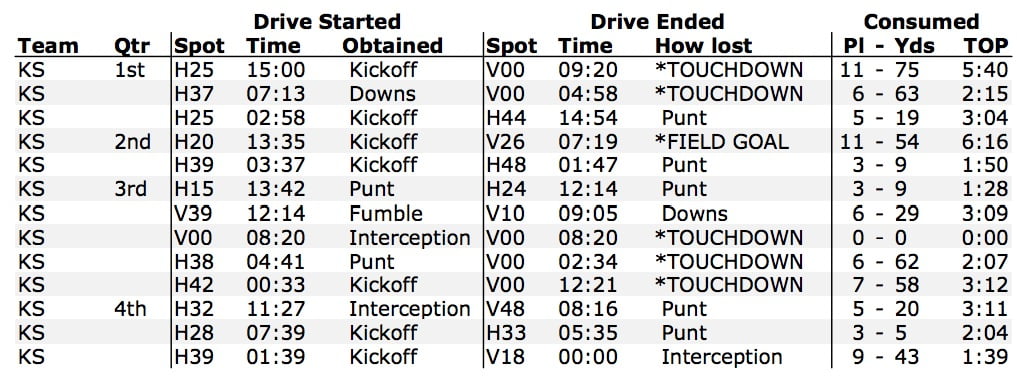
Giving up 16 points in the first four drives to a team that almost literally does not pass is not how you want to roll if you’re Oklahoma State. Neither is that 0-play, 0-yard drive in the third quarter.
- Yards per play: 5.8
- Points per drive (offense): 2.50
- Points per drive (defense): 3.58
- Points off turnovers: 7
- Average starting field position: Own 33
Kansas State didn’t really capitalize on the turnovers it created netting just seven points off of three turnovers. To contrast Oklahoma State’s final three scoring drives, Kansas State had 17 just 68 yards on 17 plays in its final three drives when OSU desperately needed stops.
The Pokes won the game when the chips were down late in the fourth quarter. Something they seem to have a history of doing.


Report: Big 12 ADs Have ‘Serious’ Talks about Not Playing Texas Tech Following Sorsby Ruling

Oklahoma State Has the Big 12’s Best Trio of Offensive Superstars

Three-Star Offensive Lineman Chase Clark Commits to Oklahoma State

Oklahoma State Flips Three-Star Offensive Lineman Sonny Mullen from Houston

Sorsby’s Temporary Injunction the Latest Example of How Broken College Athletics Is

Parsa Fallah, Kashie Natt Seeking Eligibility Waivers to Play at Oklahoma State Next Season

‘Not Enough to Make the NCAA Tournament’: Steve Lutz Is Aiming High This Season

A Look at Four of the Prospects Oklahoma State Is Set to Host This Week

Daily Bullets (June 9): Sorsby Ruling Fallout

Ruby Meylan Named to OKC Spark Reserve Pool Roster
-
 Football1 day ago
Report: Big 12 ADs Have ‘Serious’ Talks about Not Playing Texas Tech Following Sorsby Ruling
-
 Football4 days ago
Oklahoma State Has the Big 12’s Best Trio of Offensive Superstars
-
 Football2 days ago
Three-Star Offensive Lineman Chase Clark Commits to Oklahoma State
-
 Football2 days ago
Oklahoma State Flips Three-Star Offensive Lineman Sonny Mullen from Houston