
Football
How Chuba Hubbard Can Reach 2,000 Yards Rushing This Season
That Iowa State-TCU stretch will be key.
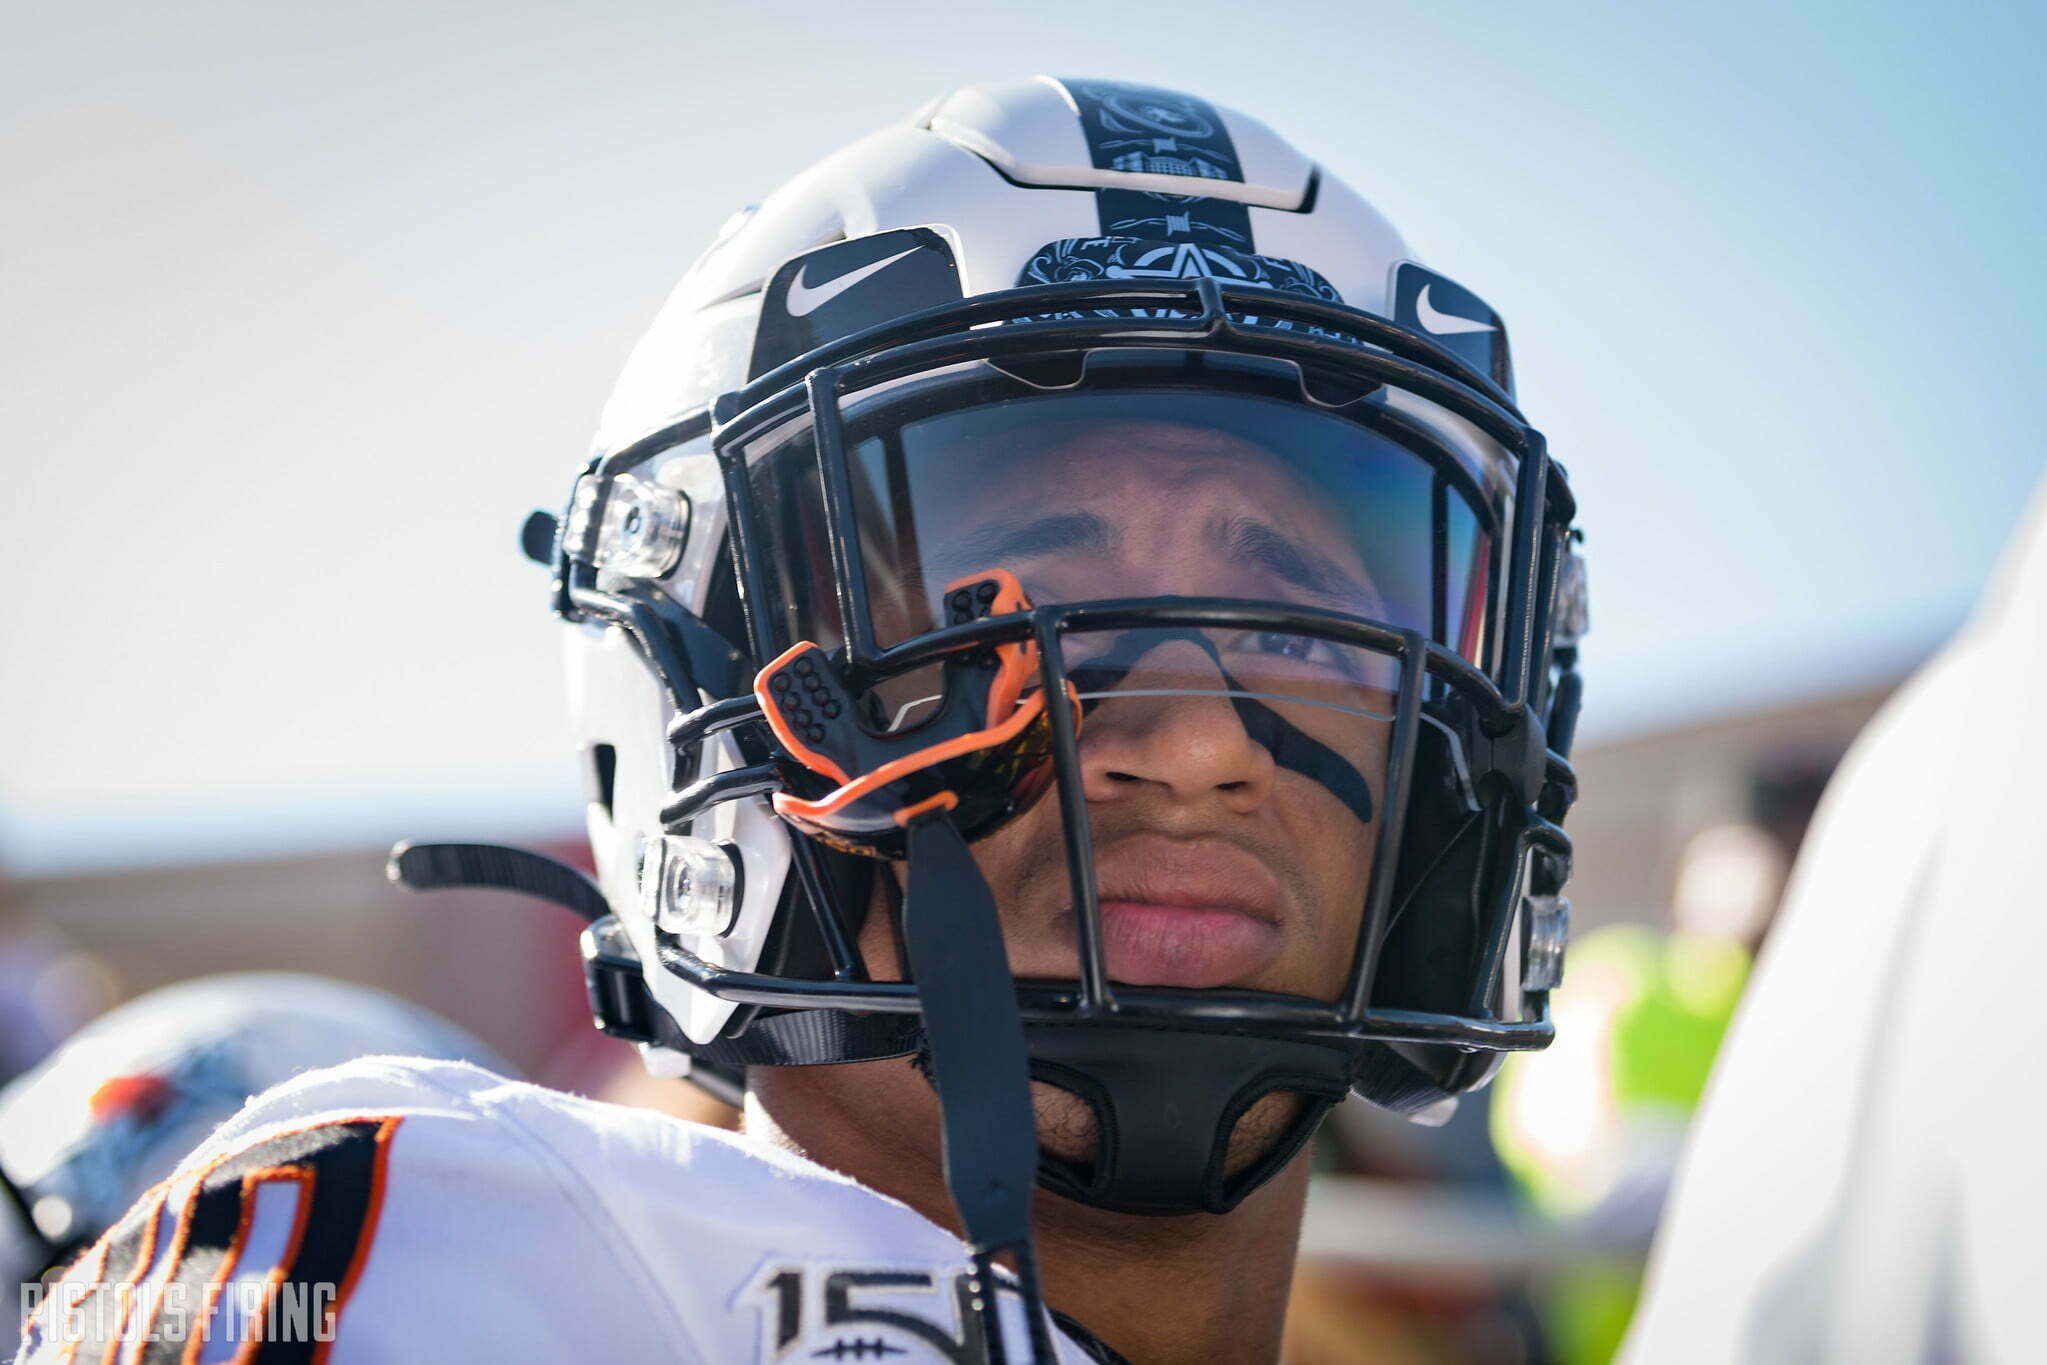
It might not be the most important question, but when there have only been 31 such seasons ever, and Chuba Hubbard is on the doorstep of being No. 32, it’s still a question that’s begging for an answer.
So let’s grab an afternoon coffee (hopefully you’re drinking Hoboken like I am right now) and do some #math to see if we can get Chuba to 2,000 yards over the next two months.
First, his numbers.
Yards per carry: 6.8
Carries per game: 27
Total rushing yards: 1,094
I also created a stat that looks at how much a team gives up on average and measures how much better Chuba was than that number in his game against that team. For example, Oregon State gives up 4.8 a carry and Chuba popped them for 8.5 a carry, which is 77 percent more than they traditionally give up.
If you go down the list of non-McNeese games, Chuba gets teams on average for about 50 percent more than they give up (this ebbs and flows obviously — Texas held him to less and he more than doubled up Kansas State — but you get the point).
So let’s go game by game.
Baylor
Yards per carry allowed: 3.18
Projected carries: 25
Projected yards (at 50 percent increase): 119 yards
I took Baylor’s yards per carry allowed, multiplied it by 1.5 (Chuba gets teams for 50 percent more than they give up, remember) and multiplied that by 25 carries because Mike Gundy has insinuated that Chuba’s carries will decrease over the second half of the season. This seems like a reasonable formula and leaves us with a new aggregate after seven games.
New total: 1,213 yards
Iowa State
Yards per carry allowed: 2.97
Projected carries: 25
Projected yards (at 50 percent increase): 111 yards
This could be the make or break game for Chuba. ISU’s run defense is legit (currently No. 21 in the country, ahead of Clemson and Florida). If Chuba hits Iowa State or TCU for 200, it might be over.
New total: 1,324 yards
TCU
Yards per carry allowed: 3.12
Projected carries: 25
Projected yards (at 50 percent increase): 117 yards
See above, but replace “No. 21 in the country” with “No. 19 in the country.”
New total: 1,441 yards
Kansas
Yards per carry allowed: 4.75
Projected carries: 25
Projected yards (at 50 percent increase): 178 yards
Shockingly, Kansas has had trouble stopping the run this season. They give up 221 a game on the ground, which might what Chuba gets in the first quarter.
New total: 1,619 yards
West Virginia
Yards per carry allowed: 4.08
Projected carries: 25
Projected yards (at 50 percent increase): 153 yards
I’m genuinely curious to see how many touches Chuba is getting by Game 11. The 27 he’s averaging are actually artificially deflated by the fact that he barely played against McNeese. And I’m giving him even fewer going forward.
New total: 1,772 yards
Oklahoma
Yards per carry allowed: 4.03
Projected carries: 25
Projected yards (at 50 percent increase): 151 yards
Literally anything could happen in this game.
New total: 1,923 yards
So as you can see it could come down to the bowl game for Chuba. Or he could run for 650 against KU, and that’s a wrap. Either way, I’m here for Chuba vs. Mt. 2K for the rest of the season.
And this has been your daily jaunt through applied mathematics toward college athletics. Most of us will go pro in something other than sports.


Roundtable Mailbag: Position Group Power Rankings, Will Mestemaker Be a First Round Pick?

Oklahoma State Lands Three-Star 2027 OL Jake Baker

Daily Bullets (June 15): Pokes Add Southeastern Lineman, Eric Morris Among Peers

OSU Baseball: Morehead State Transfer Aubrey Kearns Commits to Cowboys

Three-Star Safety Chayce Davis Commits to Oklahoma State

OSU Baseball: Oklahoma State Lands Division-II Transfer Pitcher Ben Leikam

Daily Bullets (June 19): (Former) Cowboy Leads at US Open, Pokes Lock in New Opponent at GIA

Oklahoma State Quarterback Drew Mestemaker to Attend Manning Passing Academy

Former OSU Offensive Line Commit Chase Clark Flips to Purdue

Cowboy Hoops: Oklahoma State to Host Saint Mary’s This Season
-
 Football4 days ago
Roundtable Mailbag: Position Group Power Rankings, Will Mestemaker Be a First Round Pick?
-
 Football5 days ago
Oklahoma State Lands Three-Star 2027 OL Jake Baker
-
 Daily Bullets4 days ago
Daily Bullets (June 15): Pokes Add Southeastern Lineman, Eric Morris Among Peers
-
 Baseball4 days ago
OSU Baseball: Morehead State Transfer Aubrey Kearns Commits to Cowboys