
Football
How Mike Yurcich’s and Glenn Spencer’s Groups Have Fared in the Red Zone
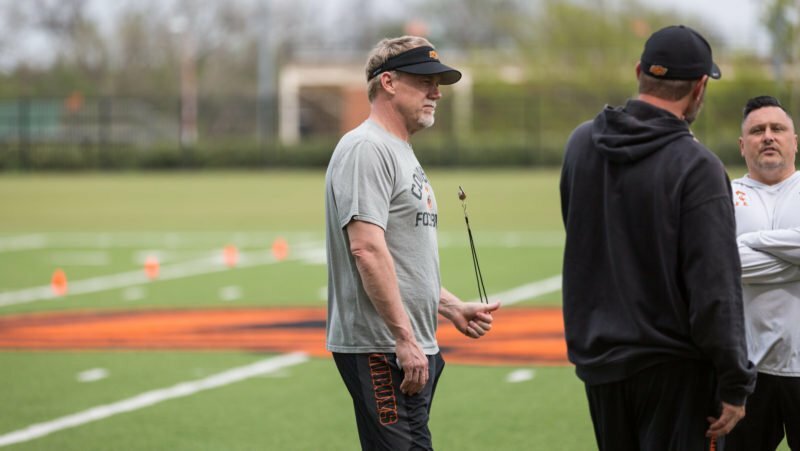
Mike Gundy has enjoyed unheard of consistency with his two coordinators, Mike Yurcich and Glenn Spencer. Each are about to finish his fifth season at his post. And there is a good chance that will change before next spring.
Yurcich just might get offered a head coaching job somewhere and many have posited that there needs to be an evaluation on both sides of the ball when it comes to OSU’s two coordinators. That’s a different post.
In this space, let’s look at how efficient both Mike Yurcich and Glenn Spencer’s groups have been in the red zone during their five-year run together. We’ll be using a number I call “PPR”. It’s simply red-zone points scored by red-zone attempts and I believe it’s the best way to determine a team’s efficiency in the red zone on either side of the ball.
First, we’ll put a bow on the final conference numbers for the 2017 regular season (before the Big 12 title game) and then we’ll look at how OSU has fared over the previous four seasons.
Offensive PPR
| Team | RZ ATT. | RZ PCT. | RZ TDs | RZ FGs | PPR |
|---|---|---|---|---|---|
| Oklahoma | 56/62 | 90.3% | 45 | 11 | 5.6 |
| West Virginia | 43/50 | 86.0% | 35 | 8 | 5.4 |
| TCU | 42/48 | 87.5% | 33 | 9 | 5.4 |
| Oklahoma State | 62/70 | 88.6% | 47 | 15 | 5.3 |
| Iowa State | 43/49 | 87.8% | 30 | 13 | 5.1 |
| Kansas | 30/32 | 93.8% | 18 | 12 | 5.1 |
| Kansas State | 41/49 | 83.7% | 27 | 8 | 4.9 |
| Texas | 35/45 | 77.8% | 27 | 8 | 4.7 |
| Texas Tech | 38/56 | 67.9% | 30 | 8 | 4.2 |
| Baylor | 31/40 | 77.5% | 18 | 13 | 4.1 |
The Cowboys certainly left some points in enemy territory this season. There were short field goal issues early and turnovers late. Any way you slice it, Oklahoma State was found lacking in this crucial area for an offense that has otherwise been historically good.
Defensive PPR
| Team | RZ ATT. | RZ PCT. | RZ TDs | RZ FGs | PPR |
|---|---|---|---|---|---|
| TCU | 17/28 | 60.7% | 10 | 7 | 3.3 |
| Texas | 33/41 | 80.5% | 20 | 13 | 4.4 |
| Kansas State | 37/47 | 78.7% | 24 | 13 | 4.4 |
| Oklahoma State | 36/43 | 83.7% | 23 | 13 | 4.7 |
| Baylor | 39/44 | 88.6% | 22 | 17 | 4.7 |
| Oklahoma | 38/44 | 86.4% | 26 | 12 | 4.9 |
| Iowa State | 32/39 | 82.1% | 25 | 7 | 5.0 |
| West Virginia | 46/55 | 83.6% | 35 | 11 | 5.1 |
| Texas Tech | 47/56 | 83.9% | 37 | 10 | 5.2 |
| Kansas | 53/59 | 89.8% | 43 | 10 | 5.6 |
Gary Patterson knows what he’s doing. TCU’s numbers are impressive to say the least. A defense that was beat-up and under-performed last season has been one of the best in college football — while facing some of its best offenses.
Oklahoma State has been mediocre at scoring in the red zone and probably avruj at defending it this year. An interesting stat, though probably completely coincidental is that most years, the offense and defense fall pretty close to each in conference ranking in PPR.
Here’s a look at both since Yurcich/Spencer took the helm of each phase.
Last five years
| Year | Off. PPR | Big 12 Rank | Def. PPR | Big 12 Rank | Record |
|---|---|---|---|---|---|
| 2017* | 5.3 | 4 | 4.7 | 4 | 9-3 |
| 2016 | 5.1 | 4 | 4.6 | 3 | 10-3 |
| 2015 | 5.4 | 2 | 5.2 | 6 | 10-3 |
| 2014 | 4.7 | 7 | 4.9 | 7 | 7-6 |
| 2013 | 5.6 | 1 | 3.9 | 1 | 10-3 |
*Not including bowl game
One point I think is important to make — and an appropriate lens to view this stat through — is that red-zone efficiency isn’t just about which team is better, it’s more about a team living up to its potential. Or not shooting itself in the foot.
Oklahoma State currently leads all FBS teams with 70 red-zone attempts and 62 red-zone scores — more than any Cowboy team since 2012 and in only 12 games. It’s tied with Ohio State for the most red-zone TDs scored. So they must be really good in the score zone, right? It’s actually closer to good, not great.
Look at the 2013 stats on offense compared to this year’s (one less game). The difference in 5.3 and 5.6 doesn’t sound like not much, but a 0.3 uptick in PPR would have resulted in 18 more points for the Cowboys on their 70 (and counting) red-zone attempts. Since OSU lost its three games by a combined 28 points, an extra 18 would have been huge.
There would be few that would call the 2013 offense better or more talented than 2017’s, but that team didn’t limit itself the same way 2017 did when on the most important part of the field.
On the defensive side of the ball it’s night and day between Spencer’s first unit and his latest. That 2013 defense held opponents to field goals on 12 of 32 attempts and more importantly held a team scoreless on 13 more attempts.
This is just one stat, but it’s a crucial one that, as we’ve seen, can have a huge effect on a season.


Roundtable Mailbag: Position Group Power Rankings, Will Mestemaker Be a First Round Pick?

Oklahoma State Lands Three-Star 2027 OL Jake Baker

Daily Bullets (June 15): Pokes Add Southeastern Lineman, Eric Morris Among Peers

OSU Baseball: Morehead State Transfer Aubrey Kearns Commits to Cowboys

Three-Star Safety Chayce Davis Commits to Oklahoma State

OSU Baseball: Oklahoma State Lands Division-II Transfer Pitcher Ben Leikam

Daily Bullets (June 19): (Former) Cowboy Leads at US Open, Pokes Lock in New Opponent at GIA

Oklahoma State Quarterback Drew Mestemaker to Attend Manning Passing Academy

Former OSU Offensive Line Commit Chase Clark Flips to Purdue

Cowboy Hoops: Oklahoma State to Host Saint Mary’s This Season
-
 Football4 days ago
Roundtable Mailbag: Position Group Power Rankings, Will Mestemaker Be a First Round Pick?
-
 Football5 days ago
Oklahoma State Lands Three-Star 2027 OL Jake Baker
-
 Daily Bullets4 days ago
Daily Bullets (June 15): Pokes Add Southeastern Lineman, Eric Morris Among Peers
-
 Baseball4 days ago
OSU Baseball: Morehead State Transfer Aubrey Kearns Commits to Cowboys