
Football
Midseason Position Grades: Running Back
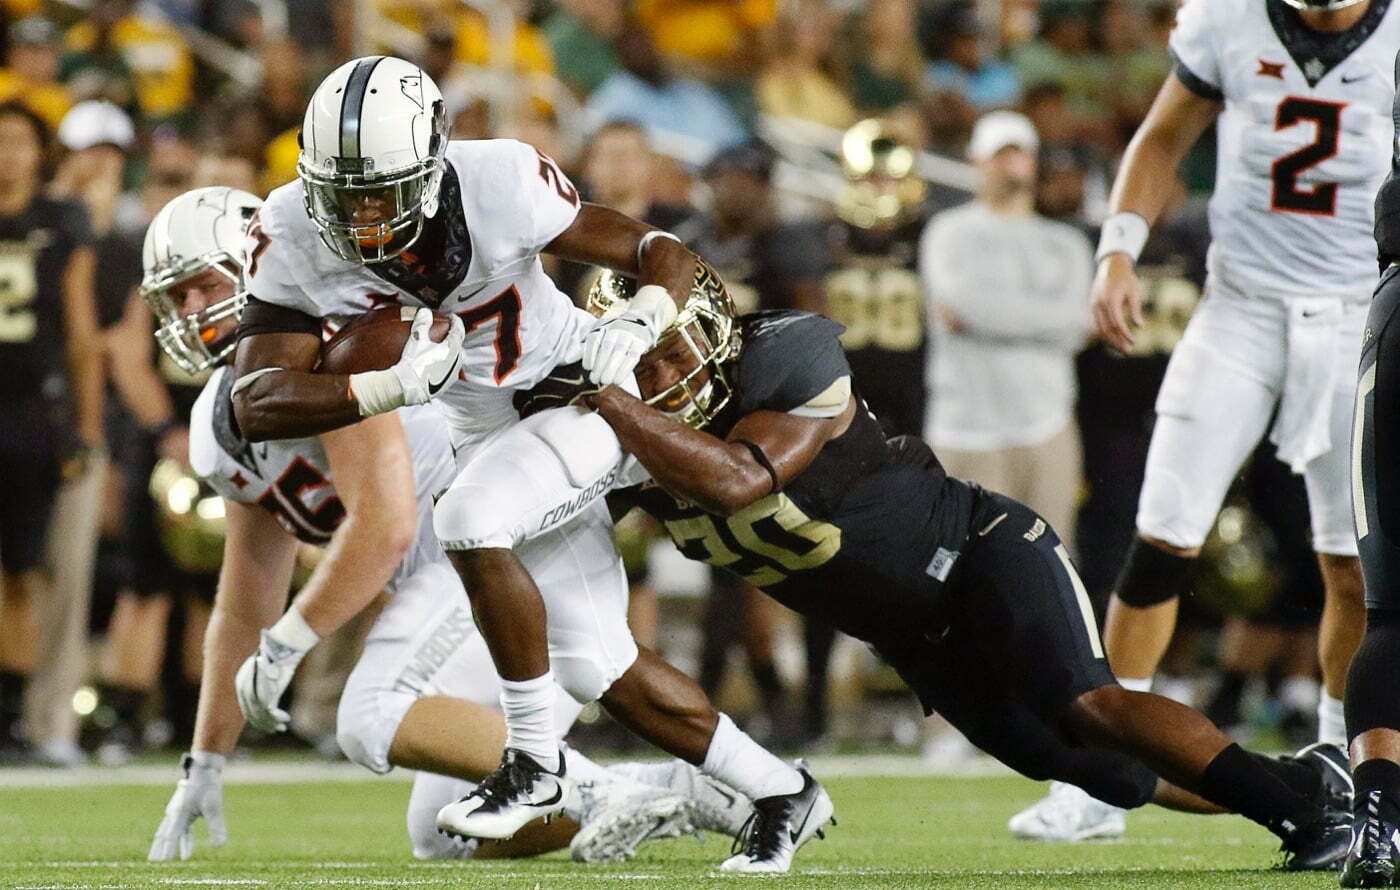
It would be hard to come up with a more maligned topic of conversation among Oklahoma State fans over the last couple of years than the Cowboys’ running game.
3.51, 3.58, and 3.43.
Those numbers represent the average yards per carry for the OSU offenses in 2014, 2015 and through the first half of 2016. Each one equally disappointing and each one ranking ninth ahead of only Kansas in the Big 12.
The Cowboys haven’t enjoyed a 1,000-yard rusher since Joseph Randle cruised to 1,417 in 2012. A school that used to be known as Tailback U hasn’t had a running game that could get out of its own way in three years.
But it looks like there might be a mini-renaissance occurring in Stillwater and it starts with a true freshman named Justice Hill. With a crowded running back group that included three seniors and a sophomore who got meaningful time last year, Hill would have made good a redshirt candidate. But he had other plans.
Those plans included playing himself into meaningful reps during fall camp and then playing himself into an early starting role, despite a couple mistimed fumbles. It’s clear Hill is the best option to get the bulk of the carries. He’s shown the ability to not only make defenders miss but to attack the hole and has the type of break-away speed that can turn decent runs into big plays.
Let’s take a look at his numbers:
- Hill: 403 yards / three touchdowns / 4.63 yards per carry
If we assume Hill continues to get 15-20 carries per game (let’s make it 15) and keeps his current average per carry, that’s an additional 486.15 yards (assuming the Cowboys go Bowling) for a total of 889.15. So, let’s round up and call it 890 yards. Chris Carson, the Cowboys’ 2015 lead rusher ended with 517 yards and 2014’s lead rusher was Desmond Roland with 770 yards. In 2013, Roland had 811. So Hill is not quite on pace to hit the 1,000-yard mark but he does have a good change to be the leading rusher since Joseph Randle.
Here’s how the rest of the group has fared so far:
- Childs: 178 yards / six touchdowns / 4.81 yards per carry
- Carr: 86 yards / one touchdown / 8.60 yards per carry
- Carson (in two games): 45 yards / one touchdown / 3.75 per carry
- Sanders: 41 yards / two touchdowns / 1.95 yards per carry
Behind the freshman is another seemingly unlikely No. 2 back. Rennie Childs has looked as good this season as we’ve probably seen him. Again, if you were to look at my projected depth chart for the running backs two months ago, it would have been way off.
I saw Childs as the odd man out with Chris Carson the starter from last year and Barry J. Sanders the supposed difference-making transfer. Of course, Carson has been injured and Carr seems to be the one lost in the mix with just ten carries from the backfield in six games. Sanders has looked good sparingly from the backfield and on special teams.
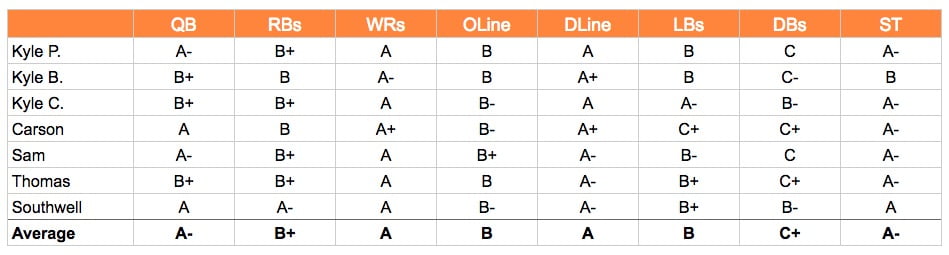
Based on OSU’s recent history with running back production, I think we can grade this group on a curve. A B+ was the grade our writers came up with and that’s what I picked as well. There are definitely improvements to be made but we’ve seen a trend in the right direction.
While it’s taken longer than most would like, the running game is improving. We can see it on the field. Blocking is getting better and so is running back play. Whether it’s in the second half of this season or next year, I think we’ll see it on the stat sheet as well.
RB Grade: B+


OSU Softball: Utah Transfer Catcher Kennedy Proctor Commits to Oklahoma State

OSU Softball: Houston Two-Way Transfer Madison Hartley Commits to Oklahoma State

How Oklahoma State’s Best Defenders Stack Up with Big 12

Roundtable Mailbag: Position Group Power Rankings, Will Mestemaker Be a First Round Pick?

Oklahoma Attorney General Pushes for Big 12 to Suspend Brendan Sorsby, Offers Legal Support

OSU Softball: Cowgirls Add Wisconsin Transfer Kendra Lewis

Three-Star Safety Chayce Davis Commits to Oklahoma State

U.S. Open Preview: The Cowboys Will Be Well Represented at Shinnecock Hills

Oklahoma State a Finalist for Offensive Line Prospect Tristan Hardin-Roberts

Daily Bullets (June 16): Possible Resolution to Sorsby Case
-
 Softball4 days ago
OSU Softball: Utah Transfer Catcher Kennedy Proctor Commits to Oklahoma State
-
 Softball3 days ago
OSU Softball: Houston Two-Way Transfer Madison Hartley Commits to Oklahoma State
-
 Football5 days ago
How Oklahoma State’s Best Defenders Stack Up with Big 12
-
 Football2 days ago
Roundtable Mailbag: Position Group Power Rankings, Will Mestemaker Be a First Round Pick?