
Football
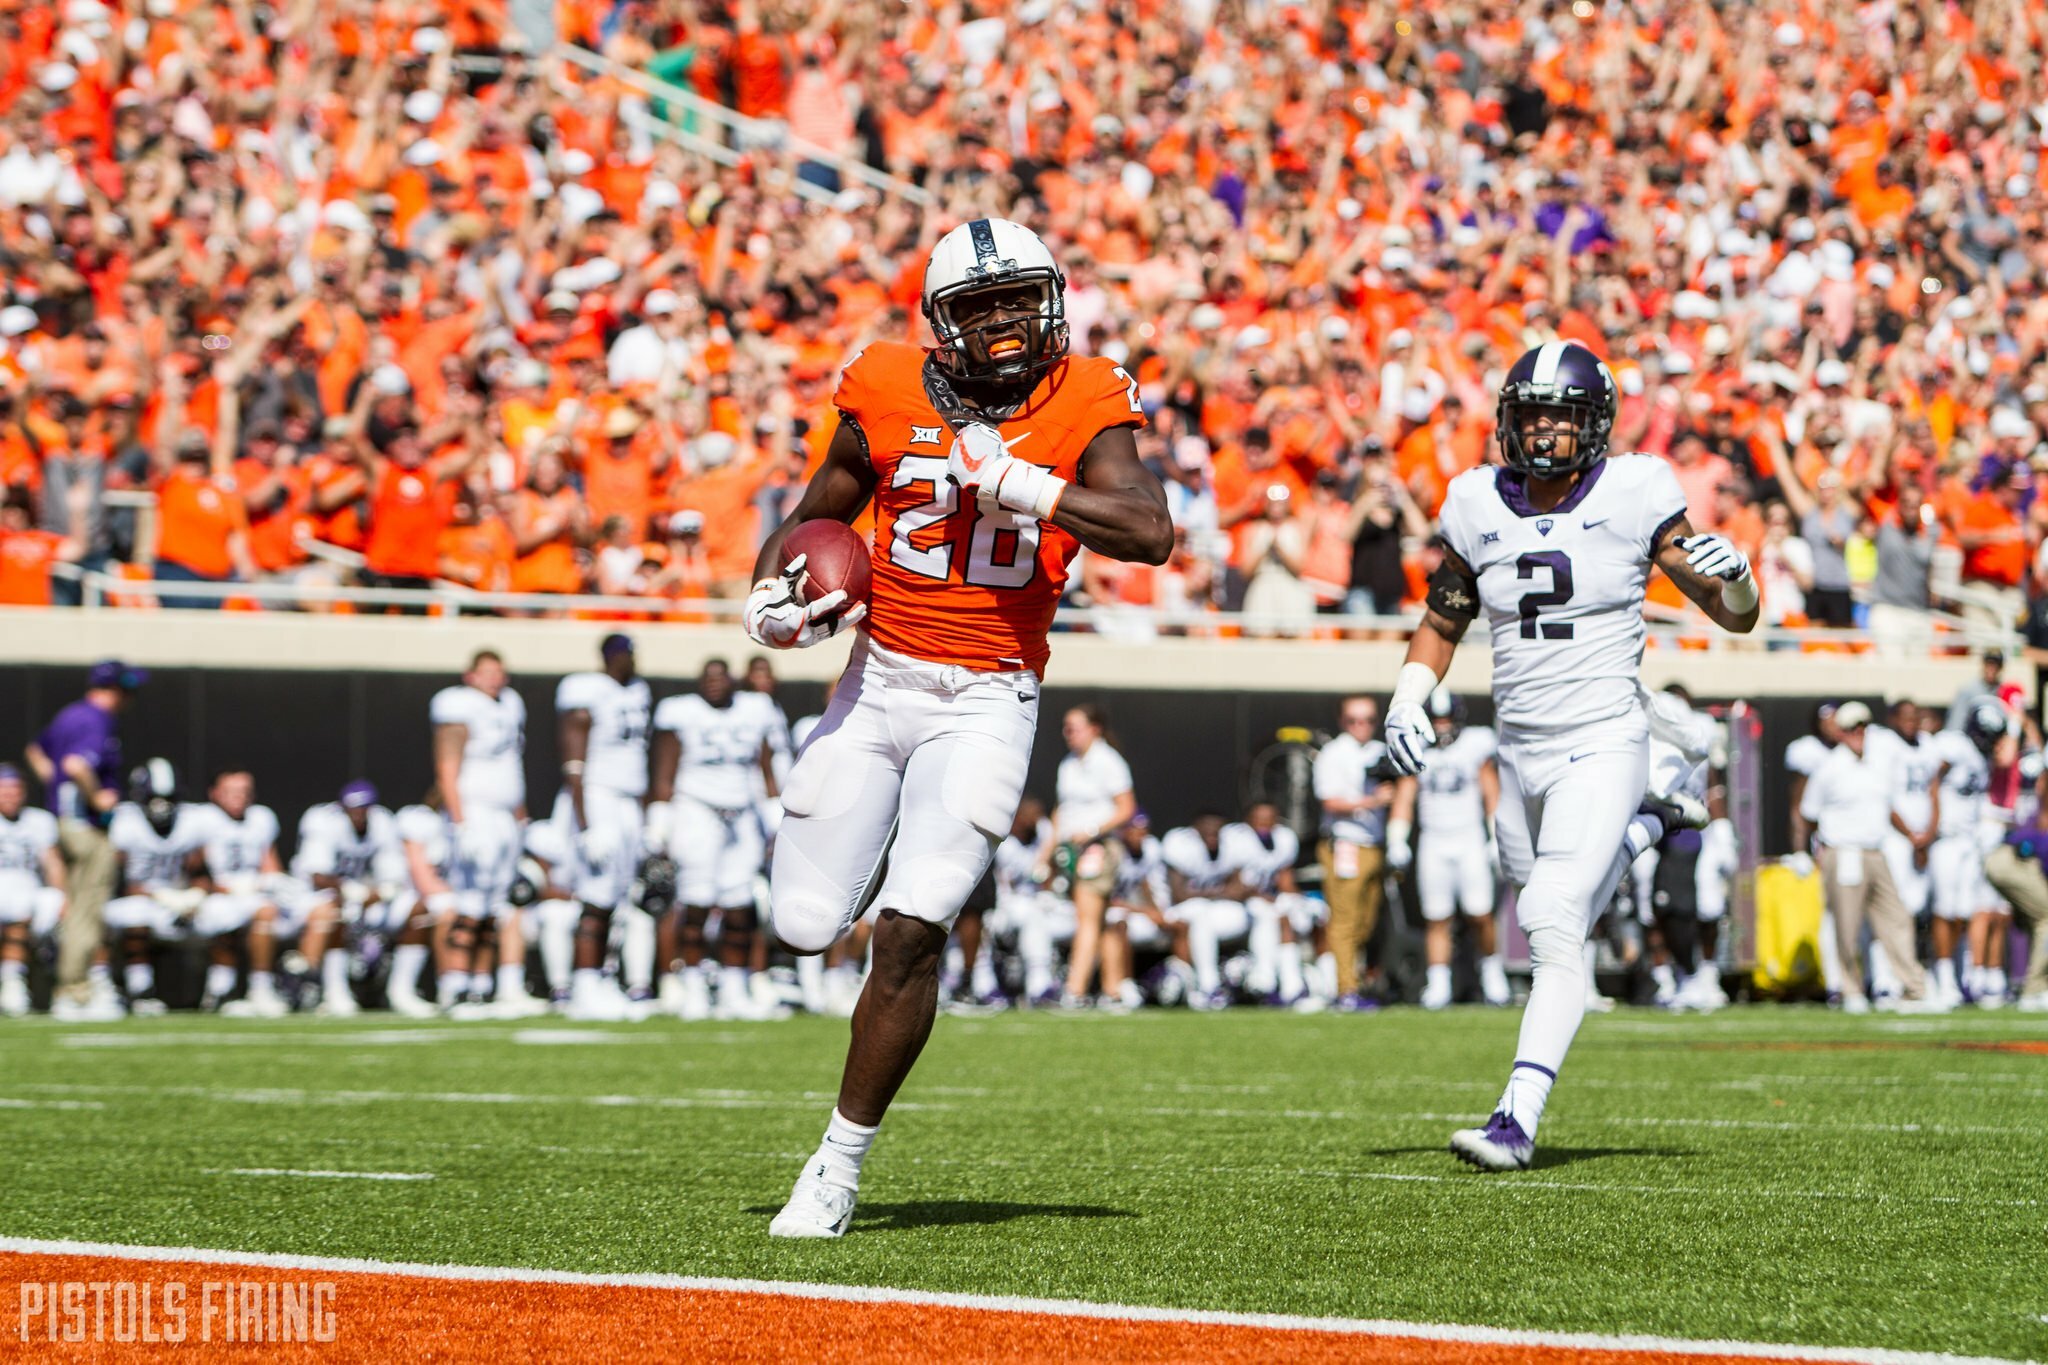
Oklahoma State’s Offensive Output is Fading, Can They Reignite Against OU?
On Wednesday I wrote about a way to sort of measure Big 12 defenses against Big 12 offenses in a way that I think makes a little bit more sense than just PPG allowed. Essentially, I took how many points per drive an offense scores overall and put an expected value on each game played. So if Oklahoma State scores 5 points per drive (I wish) and they have 10 drives against Texas Tech, the expected value is 50. If Tech holds them under that, their defense is rewarded in my system.
Let’s flip it around today and look at which offenses have been best. There won’t be many surprises here because the offenses you would think rose to the top, but it’s still interesting to look at based on who each team has played thus far.
Reminder: I used 7 as the value for all TDs so if you missed an extra point or hit a two-point conversion, the #math might not add up. I took out 0-play drives (punt returns, pick-sixes) and I left in end-of-half drives (because this is the Big 12, you can score in 30 seconds, right?)
First, here are your defensive PPD leaders in the Big 12 thus far.
Defensive PPD
| Team | PPD |
|---|---|
| Iowa State | 0.94 |
| TCU | 1.17 |
| Texas | 1.26 |
| Oklahoma State | 1.73 |
| Kansas State | 2.37 |
| West Virginia | 2.52 |
| Oklahoma | 2.65 |
| Texas Tech | 2.67 |
| Kansas | 2.92 |
| Baylor | 3.13 |
So if you go against Iowa State and have 10 drives, you’re expected to score 9.4 points. That’s unbelievable. It also gives you a look at how I arrive at the numbers. So if you score, say, 20 points against them, you get a +10.6 points. Unlike the defensive post, you want + numbers here.
Anyway, here are the expected vs. actual values. Two offenses stand alone, and one stands above the other.
Actual Offensive Output vs. Expected
| Rank | Team | Actual vs. Expected | Per Game |
|---|---|---|---|
| 1 | Oklahoma | 70.8 | 14.1 |
| 2 | Oklahoma State | 42.3 | 8.5 |
| 3 | West Virginia | 19.3 | 3.9 |
| 4 | Texas Tech | 16.9 | 3.4 |
| 5 | TCU | 2.9 | 0.6 |
| 6 | Kansas State | -1.5 | -0.3 |
| 7 | Iowa State | -18.2 | -3.6 |
| 8 | Baylor | -24.1 | -4.8 |
| 9 | Texas | -33.7 | -6.7 |
| 10 | Kansas | -74.6 | -14.9 |
OU scored about two more TDs per game than what would be expected based on the defenses they have faced and how many drives their offense has had. Here’s a look at their offensive game log.
OU Offense Log
| Team | Expected | Actual |
|---|---|---|
| Baylor | 43.9 | 49 |
| Iowa State | 9.4 | 31 |
| Kansas State | 26.0 | 41 |
| Texas | 15.2 | 30 |
| Texas Tech | 34.7 | 49 |
It feels strange to say this, but the Iowa State performance might have been one of their best considering how many drives they had (10) and how good Iowa State’s defense is. They were a +21.6 that game. Their next best is +15 against Kansas State. Now let’s look at the Cowboys.
Oklahoma State Offense Log
| Team | Expected | Actual |
|---|---|---|
| Baylor | 40.7 | 59 |
| TCU | 14.1 | 31 |
| Texas | 19.0 | 13 |
| Texas Tech | 32.1 | 41 |
| West Virginia | 47.9 | 52* |
*Again, I know OSU didn’t score 52 points, but 7 is my number for TDs regardless of XP outcome. That’s on special teams, not on the offense, and 95 percent of the time you’re going to get 7.
Best game was Baylor at +18.3. Worst game was Texas at -6. The West Virginia game is why I was still down on the offense last week. They didn’t really exceed their expected output by that many points given the fact that they had 19 drives against a mediocre defense. The offensive output against TCU was actually a little bit better (feels weird to think that, right?)
Regardless, they have been a -1.9 in the aggregate over the last two weeks. Not exactly inspiring stuff heading into Bedlam. Which is exactly what OU fans are saying about a defense that gives up 8.5 more points than expected in Big 12 games this year.
Ultimately I’m not sure this means a whole lot, but it is a fun look at which offenses have *actually* performed well so far this year and which are a mirage. Oklahoma State and OU have been pretty terrific, all things considered, which means maybe we turn to the defenses (and specifically Oklahoma State’s) to see where this game is determined on Saturday in Stillwater.


Oklahoma State Running Back Caleb Hawkins Named Walter Camp Preseason All-American

Eric Morris’ Coaching Staff Has More in Common with Contenders than Big 12 Newcomers

Player Rating Superlatives: A Look at the Fastest, Strongest Cowboys in EA Sports’ College Football 27

Steve Lutz Releases Statement on Kashie Natt’s Eligibility Pursuit

Oklahoma State’s Offense Well Represented on Big 12 All-Portal Team

Daily Bullets (July 5): Some Predix for OSU Football

Daily Bullets (July 4): Can the Defense Match the Offense, Happy 250th, America!

Texas Tech, Colorado Headline Big 12’s Top Defensive Portal Additions This Offseason

The Reload Ep. 53: World Cup Grass, Big 12 Media Days Preview

Daily Bullets (July 3): The All-Portal Pokes
-
 Football5 days ago
Oklahoma State Running Back Caleb Hawkins Named Walter Camp Preseason All-American
-
 Football4 days ago
Eric Morris’ Coaching Staff Has More in Common with Contenders than Big 12 Newcomers
-
 Football4 days ago
Player Rating Superlatives: A Look at the Fastest, Strongest Cowboys in EA Sports’ College Football 27
-
 Hoops4 days ago
Steve Lutz Releases Statement on Kashie Natt’s Eligibility Pursuit