
Football
The Computers Speak
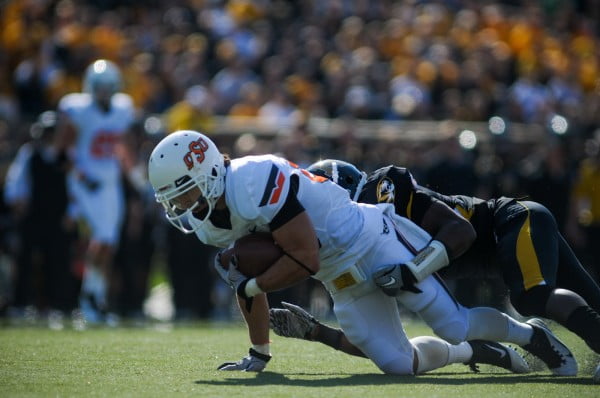
 Photo Attribution: KT King
Well, the owner of the two computers that had Alabama at #2 and OSU at #3 spoke to me (and my statistical counterpart, @OKC_Dave) anyway.
Jeff Sagarin’s computer had Alabama ahead of OSU at a 99.49 to 97.81 clip while Peter Wolfe’s computer had Bama ahead 8.969 to 8.700.
A quick explanation of the two systems before we dive in. Sagarin’s model focuses on strength of schedule and the major variables are wins, losses and venue of game. Wolfe’s model, on the other hand, measures the idea that there is a certain likelihood of one team beating another. Wolfe then rates teams against their likelihood estimate, basically actual outcome vs probability of that outcome occurring. (info h/t to BCS Knowhow)
Dave sent the following email to Sagarin:
Mr. Sagarin, I have enjoyed your rating system for years, but I have to admit this is the first time I’ve been so intensely interested in it (I’m a Oklahoma State alum). Can you please help me understand the difference between the two teams in your system given the stats that you make public?
Record
Alabama 11-1
Oklahoma State 11-1
SOS
Alabama 23
Oklahoma State 6
Record versus Sagarin top 10
Alabama 1-1
Oklahoma State 2-0
Record versus Sagarin top 30
Alabama 2-1
Oklahoma State 6-1
Sagarin Conference Ratings
Big 12 #1
SEC #2
Sagarin’s email back:
David,
In the “ELO_CHESS” (editor’s note: this is the formula used for the BCS standings) which only goes by winning/losing and the scores are IGNORED, the tail that is highly correlated with wagging the dog for undefeated and one-loss teams is who is the best team you’ve beaten, and who is the team you lost to?
For Alabama, they beat #4 (in Elo) Arkansas, and lost to #1 (in Elo) LSU
For Oklahoma State, they beat #6 (in Elo) Oklahoma, and lost to #21 (in Elo) Iowa State
I hope this sheds some light on it for you.
Thanks for writing,
Jeff
In other words A&M’s second half collapse in Jerry World combined with OU falling apart against Baylor and Tech really hurt OSU. It’s strange to think about having to root for OU, but had they beat either Baylor or Tech and OSU snagged that fourth computer, combined with these voters sobering up before casting their ballots, OSU would be partying on Bourbon Street come January 9.
My email to Dr. Peter Wolfe:
I know you’ve probably gotten a ton of these emails today, so I’ll spare you the length. I am an Oklahoma State blogger and I was simply wondering what OSU could have done to close the .269 rating gap between itself and Alabama in your model. I’ve been trying to read about the Bradley-Terry model (editor’s note: this is the complex mathematical formula that Wolfe bases his computer model on, you can read more about it here) all morning and I just don’t really understand it.
Dr. Wolfe’s email back:
Bradley-Terry starts with the idea that the likelihood of team A beating team B is (rating of A)/(rating of A + rating of B). So for example, if team A’s rating is 0.6 and team B’s rating is 0.4, then the likelihood that A beats B is 0.6/(0.6 + 0.4) = 0.6.
Since we have 4000 games, we can derive 4000 likelihoods, one for each game, by assigning ratings values to each team. But, we are in a good position: we actually know who won each of those games.
We want to assign ratings that *best* describe what actually happened. The probability, let’s call it P, of all the games coming out as they did is obtained by multiplying together the outcome likelihoods derived for each of the 4000 games – that’s a lot of numbers and the computer is helpful for this. We want this probability P to be as large a number as possible. The computer assigns an initial (and equal) value for all the teams’ ratings, then tweaks each teams ratings up or down so as to obtain the maximum value of P. When P is maximized, we conclude that the 4000 team ratings are the best values for describing what actually happened.
One way to think about Alabama and OK State’s relative position is to realize that Alabama had a “better” loss (to a higher rated team – #1 LSU), and OK State lost to #31 Iowa State. Also Alabama’s best win was against #4 Arkansas, and OK State’s best win was against #5 Kansas State.
-Peter
Keep in mind that if OSU had gained one or both of these computers, they would have still fallen short by .004 points (though if you combine that with these imbeciles voting them where they should have been voted, they would be playing for the title).
Is this post, or the fact that I’m linking you to Wikipedia pages involving math symbols neither of us has ever seen before, enough to convince you of a playoff yet?
It should be.


Caleb Hawkins Bigger, Strong, Faster Entering Sophomore Season

Drew Mestemaker Discusses the NFL Draft

Manning Passing Academy Gave Mestemaker More Confidence, Chance to Learn from Peyton, Eli

Offseason Hype Surrounds Cowboy Offense, but Cowboy Defenders Confident They’ll Be the Surprise Story This Fall

Daily Bullets (July 8): OSU at Big 12 Media Days

OSU Baseball: Four Cowboys Drafted on Day 2 of MLB Draft

OSU Baseball: Kollin Ritchie Announces Return Following MLB Draft Selection

Daily Bullets (July 12): Several Cowboys Await Day 2 of MLB Draft

OSU Baseball: San Diego Padres Draft Alex Conover in Round 4

Daily Bullets (July 11): Coach Mike Earns (Another) Big Break
-
 Football4 days ago
Caleb Hawkins Bigger, Strong, Faster Entering Sophomore Season
-
 Football4 days ago
Drew Mestemaker Discusses the NFL Draft
-
 Football4 days ago
Manning Passing Academy Gave Mestemaker More Confidence, Chance to Learn from Peyton, Eli
-
 Football3 days ago
Offseason Hype Surrounds Cowboy Offense, but Cowboy Defenders Confident They’ll Be the Surprise Story This Fall