
Football
Turnovers as a Percentage
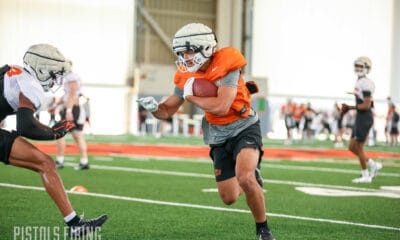
 Photo Attribution: US Presswire
OKC Dave wrote a great post last week about how OSU wasn’t simply a one year wonder in terms of forcing turnovers. Bill Young’s unit has been doing it for years (I could probably phrase that better).
But a reader brought up a good point: sure, OSU led the country in the country in turnovers forced per game but as we all know, they were on the field far more often than some of the other defenses that had an affinity for takeaways.
So why don’t we look at takeaways as a percentage. (oh wait, the reader (Clint) who posed the question also looked it up!)
Here’s what he found:
OSU faced 1089 plays last season (541 pass vs 548 rush).
OSU intercepted 24 of 541 passes (4.4%).
OSU recovered 20 fumbles out of 1089 total plays (1.8%).
OSU forced 44 turnovers out of 1089 plays, or a turnover on 4.04% of plays.
For some context let’s look at what Alabama did last year…
Alabama faced 720 plays (334 pass vs 386 rush).
Alabama intercepted 13 of 334 passes (3.9%).
Alabama recovered 7 fumbles out of 720 total plays (0.9%).
Alabama forced 20 turnovers out of 720 plays, or a turnover on 2.78% of plays.
LSU forced turnovers on 3.34% of plays, OU on 2.85%, and Texas on 2.75%.
OKC Dave did the final legwork for OSU’s turnover rate as a % for the last five years:
2007: 2.0% (98th in the NCAA)
2008: 2.7% (63rd)
2009: 3.3% (21st)
2010: 3.2% (26th)
2011: 4.0% (3rd)
So yes, leading the country in takeaways is sort of a function of having a wicked offense that scores faster than Ryan Lochte at the Olympic Village but it’s also pretty strong relative to those grind-it-out SEC defenses as well.


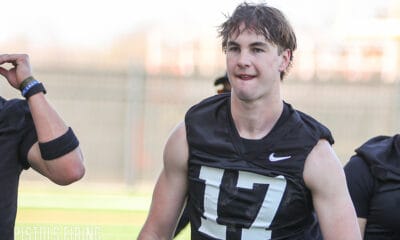
Caleb Hawkins Bigger, Strong, Faster Entering Sophomore Season

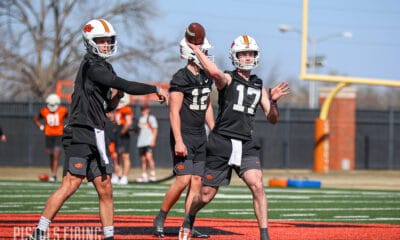
Drew Mestemaker Discusses the NFL Draft

Manning Passing Academy Gave Mestemaker More Confidence, Chance to Learn from Peyton, Eli

Offseason Hype Surrounds Cowboy Offense, but Cowboy Defenders Confident They’ll Be the Surprise Story This Fall

Daily Bullets (July 8): OSU at Big 12 Media Days

OSU Baseball: Four Cowboys Drafted on Day 2 of MLB Draft

OSU Baseball: Kollin Ritchie Announces Return Following MLB Draft Selection

Daily Bullets (July 12): Several Cowboys Await Day 2 of MLB Draft

OSU Baseball: San Diego Padres Draft Alex Conover in Round 4

Daily Bullets (July 11): Coach Mike Earns (Another) Big Break
-
 Football4 days ago
Caleb Hawkins Bigger, Strong, Faster Entering Sophomore Season
-
 Football4 days ago
Drew Mestemaker Discusses the NFL Draft
-
 Football4 days ago
Manning Passing Academy Gave Mestemaker More Confidence, Chance to Learn from Peyton, Eli
-
 Football4 days ago
Offseason Hype Surrounds Cowboy Offense, but Cowboy Defenders Confident They’ll Be the Surprise Story This Fall