
Feature
Where Does OSU Rank Nationally In Best Programs Of Last 10 Years?
Where does Oklahoma State’s winning percentage of 74 percent rank among the best teams in the country?
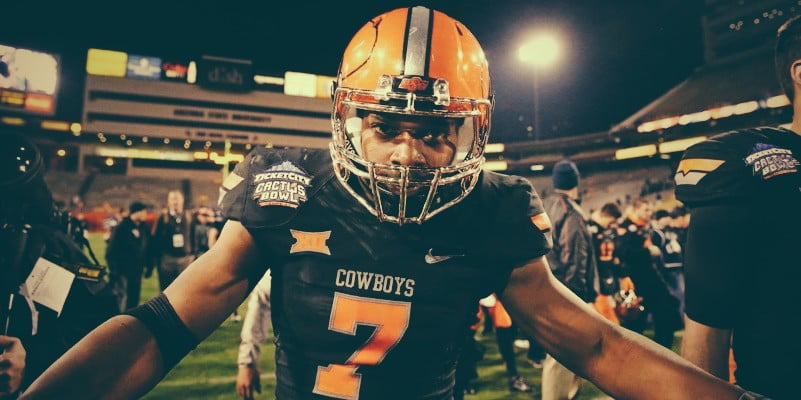
When Brandon Chatmon wrote today that Oklahoma State was sporting a 74 percent winning percentage over the last five years, I got curious.
Curious about where that stood nationally and what the scene looked like if you extended the timeframe to an even more round number like, say, the number of years Mike Gundy has been at the helm in Stillwater (10).
So, I did a little legwork and have the goods. Let’s look at the last 10 years first because that’s the worse showing for the Pokes. An aside: There are a million ways to determine how good a program is. This is certainly one of them, but it’s not all-encompassing.
Oregon, for instance, is docked for simply making it to the Playoff last year.
Postseason records:
Oklahoma State: 1-0 (100 percent)
Oregon: 1-1 (50 percent)
Oregon’s winning percentage goes down, OSU’s goes up. Which was the better team? It also doesn’t account for lousy non-conference schedules. But still, over the course of a decade with as many conference games as every team plays, it’s still a pretty good indicator of the type of program you have.
Anyway, here’s a look.
Last 10 years
| Rank | School | Games | Wins | Percentage |
| 1 | Boise State | 131 | 112 | 85.50% |
| 2 | Ohio State | 130 | 109 | 83.85% |
| 3 | Alabama | 132 | 106 | 80.30% |
| 4 | Oregon | 131 | 105 | 80.15% |
| 5 | Texas Christian | 127 | 99 | 77.95% |
| 6 | Louisiana State | 131 | 102 | 77.86% |
| 7 | Southern California | 130 | 99 | 76.15% |
| 8 | Oklahoma | 133 | 101 | 75.94% |
| 9 | Wisconsin | 132 | 97 | 73.48% |
| 10 | Florida | 129 | 94 | 72.87% |
| 11 | Texas | 130 | 94 | 72.31% |
| 12 | Florida State | 133 | 95 | 71.43% |
| 13 | Virginia Tech | 133 | 95 | 71.43% |
| 14 | Georgia | 131 | 93 | 70.99% |
| 15 | Penn State | 127 | 89 | 70.08% |
| 16 | Georgia Southern | 10 | 7 | 70.00% |
| 17 | Brigham Young | 128 | 89 | 69.53% |
| 18 | Missouri | 131 | 90 | 68.70% |
| 19 | West Virginia | 127 | 87 | 68.50% |
| 20 | Cincinnati | 127 | 86 | 67.72% |
| 21 | Clemson | 129 | 87 | 67.44% |
| 22 | Auburn | 128 | 86 | 67.19% |
| 23 | Nebraska | 131 | 87 | 66.41% |
| 24 | Utah | 126 | 83 | 65.87% |
| 25 | Oklahoma State | 127 | 83 | 65.35% |
| 26 | Michigan State | 128 | 83 | 64.84% |
| 27 | South Carolina | 128 | 83 | 64.84% |
| 28 | Louisville | 125 | 81 | 64.80% |
| 29 | Northern Illinois | 132 | 85 | 64.39% |
| 30 | Navy | 128 | 81 | 63.28% |
Not bad. A top 25 program (barely) over the last 10 years. 1990s us would have all died of joy. Now, let’s look at the last five years.
Last five years
| Rank | School | Games | Wins | Percentage |
| 1 | Oregon | 67 | 59 | 88.06% |
| 2 | Alabama | 66 | 57 | 86.36% |
| 3 | Florida State | 68 | 57 | 83.82% |
| 4 | Ohio State | 66 | 55 | 83.33% |
| 5 | Boise State | 65 | 54 | 83.08% |
| 6 | Northern Illinois | 69 | 56 | 81.16% |
| 7 | Stanford | 67 | 54 | 80.60% |
| 8 | Michigan State | 66 | 52 | 78.79% |
| 9 | Louisiana State | 65 | 51 | 78.46% |
| 10 | Oklahoma | 66 | 51 | 77.27% |
| 11 | South Carolina | 65 | 48 | 73.85% |
| 12 | Oklahoma State | 64 | 47 | 73.44% |
| 13 | Wisconsin | 67 | 49 | 73.13% |
| 14 | Texas Christian | 63 | 46 | 73.02% |
| 15 | Baylor | 64 | 46 | 71.88% |
| 16 | Clemson | 64 | 46 | 71.88% |
| 17 | Central Florida | 66 | 47 | 71.21% |
| 18 | Kansas State | 64 | 45 | 70.31% |
| 19 | Louisville | 64 | 45 | 70.31% |
| 20 | Georgia Southern | 10 | 7 | 70.00% |
Get out of here, Georgia Southern!
Pretty solid for the Cowboys, though. No. 2 in the Big 12 behind OU (barely!) And inside the top 10 of power conference squads. There’s no questioning what Mike Gundy has built in Stillwater. Sometimes it’s fun just to sit atop Boone Pickens Stadium (metaphorically, of course) and observe the kingdom he’s constructed.


Report: Judge Deems Kashie Natt Eligible

Chasing Gundy: Eric Morris Praises Former Oklahoma State Head Coach at Big 12 Media Days

Eric Morris Shouts Out Some Defensive Standouts at Big 12 Media Days

Where Drew Grew: How Mestemaker Developed as a QB This Offseason

Drew Mestemaker Named Big 12 Newcomer of the Year, Wyatt Young on Preseason All-Big 12 Team

Daily Bullets (July 11): Coach Mike Earns (Another) Big Break

Former Oklahoma State Coach Mike Boynton Inks Two-Year Deal with Michigan

Eric Morris Took Early Steps to ‘Squash’ Natural Divisions within OSU’s Locker Room

The Reload Ep. 54: Big 12 Media Days Recap

Daily Bullets (July 10): Eric Morris’ Playcalling, OSU at 9-3?
-
 Hoops5 days ago
Report: Judge Deems Kashie Natt Eligible
-
 Football4 days ago
Chasing Gundy: Eric Morris Praises Former Oklahoma State Head Coach at Big 12 Media Days
-
 Football4 days ago
Eric Morris Shouts Out Some Defensive Standouts at Big 12 Media Days
-
 Football4 days ago
Where Drew Grew: How Mestemaker Developed as a QB This Offseason