
Football
Why Mike Yurcich’s 2018 Offense Was Better Than You Think
And why the defense was a lot worse.
I normally title this post “annual PPD updates” and 10 of you mathematicians click on it so for the others of you here because you want to be #MadOnline about Mike Yurcich, welcome to my playground.
Point No. 1: Oklahoma State’s offense, despite some truly woeful spurts, was overall about the same as it’s been for the past few years under Mason Rudolph (excluding 2017). I repeat, Corndog and Rudolph both lead top-25 offenses (but Rudolph did it three different times).
Counterpoint No. 1: The second half against Texas Tech, first half against TCU and entire game against Kansas State.
Point No. 2: Good point. There’s not really a rebuttal to that. OSU was bad against those three teams for big stretches (and you could probably even throw Baylor in there as well). It’s something that has plagued Yurcich throughout his career — an inability to make quick, fluid in-game changes that produce results. Is it a fireable offense? No, but it’s certainly an issue.
Anyway, here’s a look at OSU’s points per drive numbers since 2007 (when the good people at BCF Toys started keeping track). These numbers, by the way, throw out garbage time drives and games against non-FBS opponents.
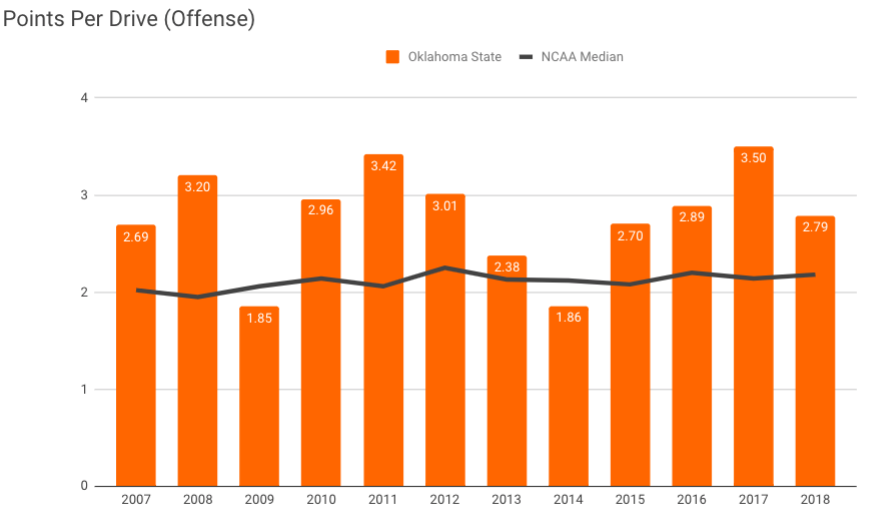
That’s pretty good for a brand-new QB and question marks coming in when it came to No. 1 receiver. It didn’t feel like a better offensive season than, say, 2015 when OSU posted fewer points per drive, did it? Well you’ll understand why they went 6-6 in 2018 and 10-2 in 2015 when you look at the defensive numbers.
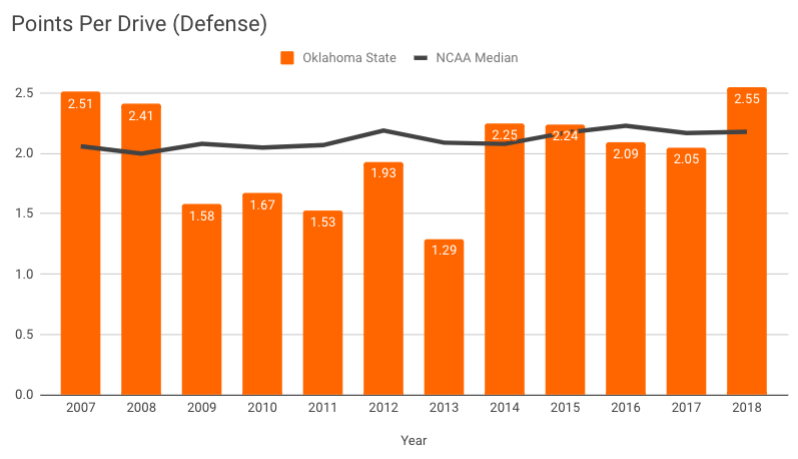
The worst number (so far) since this data has been kept. Far, far worse than anything Glenn Spencer posted in his five seasons in Stillwater and slightly worse than the previous worst, which was 2007. So when you see 2.55 against 2.05 in 2017, you might say, Well what’s the big deal with 0.5 points per drive. Considering the fact that OSU sees 10-15 drives per game on defense, that’s 5-8 additional points.
I KNOW A FEW GAMES WHERE OSU COULD HAVE BENEFITED FROM THE OTHER TEAM NOT SCORING AN ADDITIONAL 5-8 POINTS!
Four of OSU’s six losses were by a TD or less. It’s not that simple of course, but I think this next graph is telling. This is the median national defensive PPD vs. OSU’s. The median, coincidentally, was West Virginia this season at 2.18 points per drive allowed. Lower is better here (i.e. 2013 is the best).
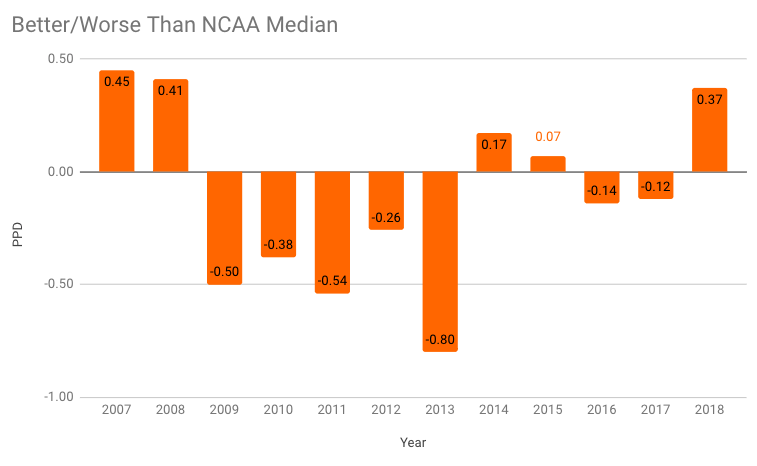
As you can see, scoring has increased since 2007 so in some ways that 2007 (and even 2008) defense was inferior to 2018. But that’s like saying McDonald’s is inferior to Wendy’s. At that point, who cares.
Again, *holds nose and closes eyes while typing* points per drive aren’t everything. They’re one stat that tells a decent story of what a team is over the course of a season. OSU’s offenses are held to a high standard, and they should be. But not all bad defense is created equal, and this year’s version was an especially putrid one.
The most problematic thing with the Cowboys offensively is that they relied too much on momentum. If they scored, they might score on six drives in a row. But if they didn’t? They might look like they’d never score again (YOU WATCHED THE TCU GAME!)
On the flip side, OSU’s defense had awesome performances at times — the first half against Kansas State and second halves against OU and West Virginia come to mind. But they dug holes too deep for Corn to sprout, and as a result the Liberty Bowl or (please don’t let it be so!) Lockheed Martin Armed Forces Bowl awaits.


Four-Star In-State Target Israel Hammons to Announce College Decision Friday

Three-Star Safety Chayce Davis Commits to Oklahoma State

Oklahoma State a Finalist for Offensive Line Prospect Tristan Hardin-Roberts

OSU Softball: Mississippi State Transfer Pitcher Delainey Everett Commits to Oklahoma State

U.S. Open Preview: The Cowboys Will Be Well Represented at Shinnecock Hills

Daily Bullets (June 21): Cowboys Land a Pair of Power Four Pitchers

OSU Baseball: Cowboys Land Washington Pitcher Noah Kenney, Texas Tech Transfer Will Jordan

Wyatt Hendrickson Makes United States World Team

Daily Bullets (June 20): Eric Morris Reels in a Four-Star, Doug Gottlieb Extended

WATCH: Eric Morris Puts Three Oklahoma State Walk-Ons On Scholarship
-
 Football3 days ago
Four-Star In-State Target Israel Hammons to Announce College Decision Friday
-
 Football5 days ago
Three-Star Safety Chayce Davis Commits to Oklahoma State
-
 Football5 days ago
Oklahoma State a Finalist for Offensive Line Prospect Tristan Hardin-Roberts
-
 Softball2 days ago
OSU Softball: Mississippi State Transfer Pitcher Delainey Everett Commits to Oklahoma State