
Football
By the Numbers: Oklahoma State Less Efficient on Offense Last Week

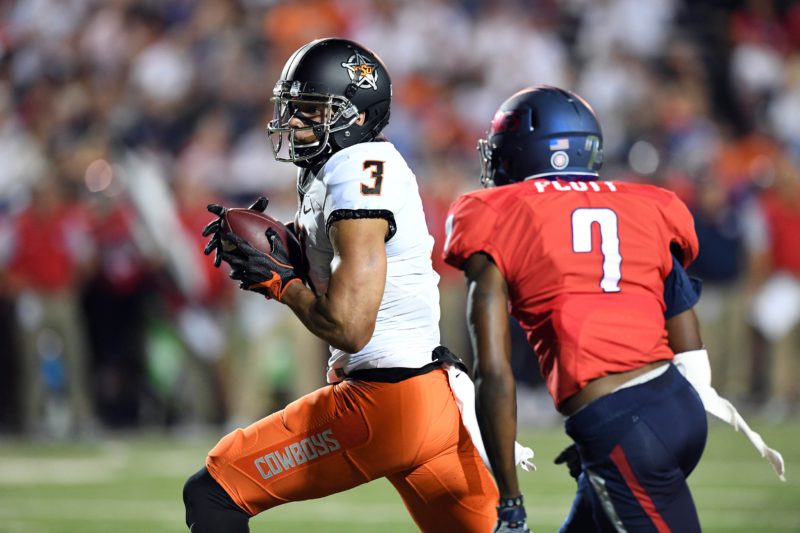
Oklahoma State rolled through Mobile, Alabama on Friday evening to the tune of a 44-7 shellacking, but its offense wasn’t quite as efficient as it was in Game 1 against Tulsa. Let’s take a look at some drive charts today recapping the festivities.
OSU Drive Chart
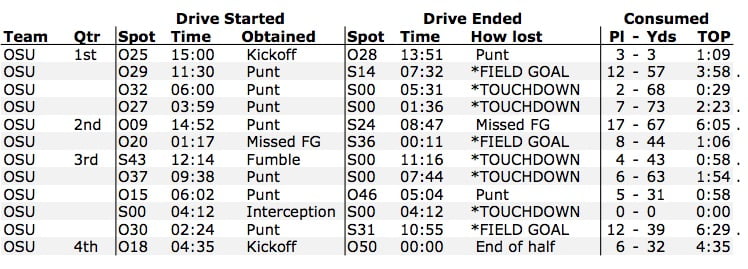
Three of OSU’s first five drives ended outside of the end zone. That’s not a great number against South Alabama, especially after what the Pokes did to Tulsa just one week prior. We’re picking nits at this point with this offense, but that’s what you do with championship contenders.
OSU’s Pertinent Numbers
- Points per drive (offense): 3.36
- Points per drive (defense): 0.58
- Yards per play: 6.5
- Third-Down conversions: 7/16 (44%)
- Average starting field position: own 34-yard line
- Red-zone scoring: 5/6
- Points off turnovers: 14
- Time of possession: 30:04
OSU’s yards per play was lower than the Tulsa game because it didn’t run the ball all that well on Friday. It posted 13.2 yards per completion (similar to TU) but just 4.4 yards per carry (compared to 9.0 in the Tulsa game). Also, OSU averaged 4.3 points per drive against Tulsa (holy Monkens) but *just* 3.4 against USA. That 0.58 PPD mark on defense makes me giddy, though.
USA Drive Chart
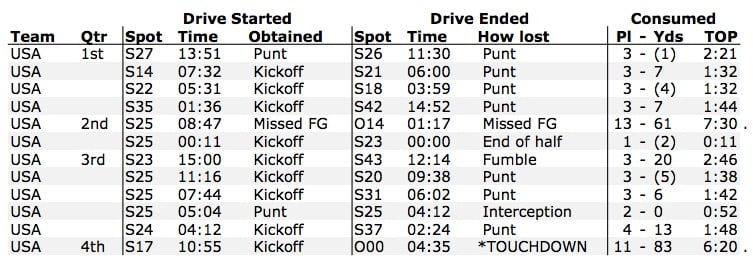
How about that first half drive chart? Punt, punt, punt, punt, missed FG, end of half, thanks for playing. It didn’t get much better in the second half, and Oklahoma State only allowed USA to gain 92 yards before its final drive of the night. Through USA’s first eight drives, it had as many that gained negative yardage (4) as it had that gained positive yardage.
USA’s Pertinent Numbers
- Points per drive (offense): 0.58
- Points per drive (defense): 3.36
- Yards per play: 3.4
- Third-down conversions: 1/10 (10%)
- Average starting field position: own 24-yard line
- Red-zone scoring: 1/2
- Points off turnovers: 0
- Time of possession: 29:56
Have to get better on that red zone scoring percentage, IMO.
I’m kidding of course. OSU was dominant in every facet of the game on Friday, and the stats show it. Most encouraging, maybe, is the fact that the Pokes slowed South Alabama in third down conversion percentage, a point of emphasis going into the game. Also, one of the sneaky biggest reasons Oklahoma State succeeds in the Mike Gundy era is because its average starting field position is almost always 5-10 yards better than its opponent’s. That’s big when you run as many possessions as the Pokes do.


The Final Draw: Did UCF Expose Cracks in the Cowboy Defense That Houston Can Exploit?

Three Things Houston Coach Willie Fritz Said Ahead of Oklahoma State’s Game Against the Cougars

Scott Frost Says He’ll Be ‘Surprised’ if Drew Mestemaker Is in College Next Year

Oklahoma State Schedules Home-and-Home with Mississippi State

NFL Update: Jaylen Warren Makes History, Justice Hill Breaks Loose, Ollie Gordon Scores Again

Do I Like a 24-Team Playoff? No, Will I Watch? Of Course

Eric Morris, Players Reveal Surprising Truth About Cowboys’ Halftime Adjustments

Game Preview: Kick Time, TV Info, Stats for Oklahoma State-Houston

PFB Picks: Predicting Oklahoma State’s Week 7 Matchup Against Houston

Daily Bullets (Oct. 16): Mestemaker Turning (More) Heads
-
 Football5 days ago
The Final Draw: Did UCF Expose Cracks in the Cowboy Defense That Houston Can Exploit?
-
 Football5 days ago
Three Things Houston Coach Willie Fritz Said Ahead of Oklahoma State’s Game Against the Cougars
-
 Football5 days ago
Scott Frost Says He’ll Be ‘Surprised’ if Drew Mestemaker Is in College Next Year
-
 Football3 days ago
Oklahoma State Schedules Home-and-Home with Mississippi State