
Football
Defense Tracker: Where OSU’s 2020 Defense Finished among Gundy’s Best
OSU’s defense had the best third-down percentage that Gundy has ever had.
For the first time since 2013, the Cowboys’ defense held its opponents to under 25 points per game in 2020.
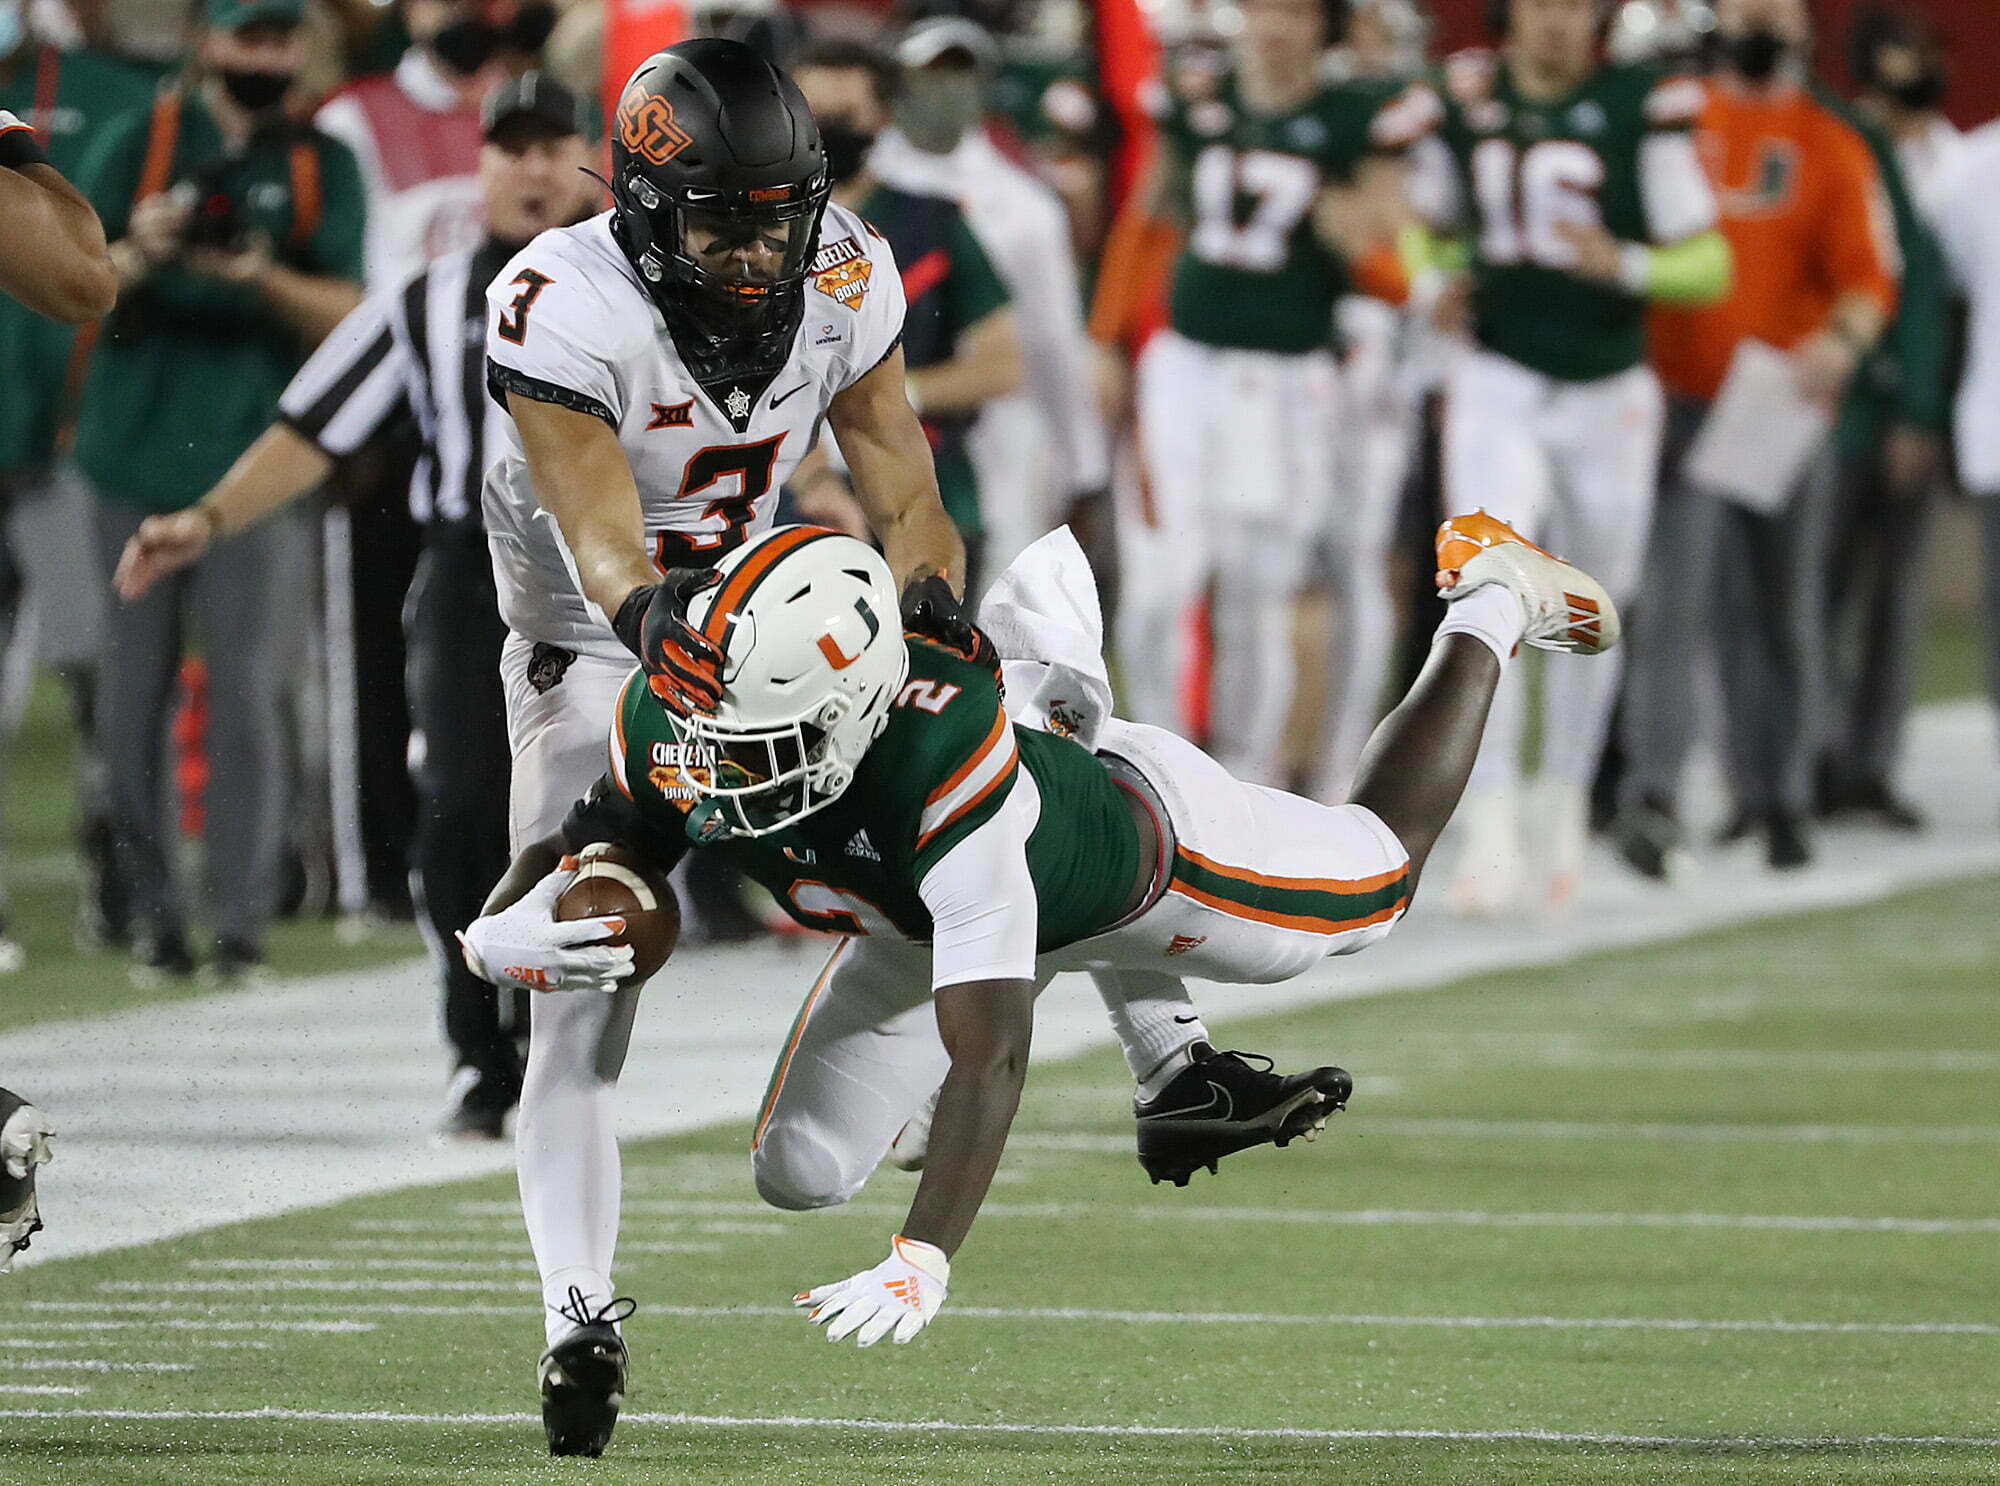
Oklahoma State capped its season off with a Cheez-It Bowl victory against Miami on Tuesday. After every game this season, we’ve looked at how OSU’s defense stacked up against other Cowboy defenses of the Mike Gundy era. Here is how our chart finished the 2020 season.
| Year | Points per game | Total offense per game | Turnovers per game | Third-Down Conversions |
|---|---|---|---|---|
| 2005 | 31.3 | 419.6 | 1.8 | 54-for-158 (34%) |
| 2006 | 25.6 | 364.1 | 2 | 67-for-169 (37%) |
| 2007 | 29.5 | 443 | 1.5 | 78-for-189 (41%) |
| 2008 | 28.1 | 405.5 | 1.5 | 71-for-177 (40%) |
| 2009 | 21.7 | 332.5 | 2.3 | 65-for-191 (34%) |
| 2010 | 26.4 | 409.5 | 2.6 | 104-for-239 (44%) |
| 2011 | 26.8 | 456.8 | 3.4 | 89-for-213 (42%) |
| 2012 | 28.2 | 421.7 | 1.7 | 78-for-215 (36%) |
| 2013 | 21.6 | 384.9 | 2.5 | 72-for-229 (31%) |
| 2014 | 31.2 | 432 | 1.1 | 84-for-206 (41%) |
| 2015 | 30.5 | 439.1 | 2.9 | 89-for-211 (42%) |
| 2016 | 26.5 | 446.3 | 1.9 | 76-for-195 (39%) |
| 2017 | 29.4 | 409.3 | 1.8 | 80-for-206 (39%) |
| 2018 | 32.5 | 452.5 | 1 | 71-for-189 (38%) |
| 2019 | 26.8 | 412.3 | 1.5 | 75-for-191 (39%) |
| 2020 | 23.5 | 379 | 1.5 | 44-for-166 (27%) |
In the Gundy era, OSU’s 2020 defense had the third-best season in points allowed per game, the third-best season in yards allowed per game, the 14th-best season in turnovers per game and the Cowboys’ 2020 defense was the best on third down that Gundy has ever had.
The seasons I’ve most closely compared 2020 to are 2013 and 2009. Here is a look at those three seasons and where they ranked among Gundy’s defenses in each stat.
| Year | Points per game | Total offense per game | Turnovers per game | Third-Down Conversions |
|---|---|---|---|---|
| 2020 | 3 | 3 | 14 | 1 |
| 2013 | 1 | 4 | 4 | 2 |
| 2009 | 2 | 1 | 5 | 4 |
Taking those four stats into account, OSU’s 2020 defense finished with an average ranking of 5.3. The 2013 defense had a 2.8, and the 2009 D had a 3.0. So, it doesn’t look as if 2020 usurped 2013 or 2009, but it put up a good fight.
This chart also provides a look at how Jim Knowles has done in his third year.
| Year | Points per game | Total offense per game | Turnovers per game | Third-Down Conversions |
|---|---|---|---|---|
| 2018 | 32.5 | 452.5 | 1 | 71-for-189 (38%) |
| 2019 | 26.8 | 412.3 | 1.5 | 75-for-191 (39%) |
| 2020 | 23.5 | 379 | 1.5 | 44-for-166 (27%) |
That’s some good improvement year by year. Teams got an average of 73.5 yards less on OSU in 2020 than they did in Knowles’ first season.
So, the 2020 defense didn’t end up being the best in Gundy’s tenure, but Gundy and Knowles put together a group that started to change the perception of defense at OSU and in the Big 12.


We Simulated Oklahoma State’s 2026 Season 100 Times, Here’s What Happened

‘A Whole Other Animal’: Steve Lutz on Navigating Lawsuits, Eligibility and NIL at Oklahoma State

Cowboys’ Highly Touted Freshman Class and Slimmed Down Sophomores Signal Bright Future

Oklahoma State Football Announces New Futuristic Partnership

Oklahoma State Hoping to Use Puerto Rico Trip to Springboard Cowboys Ahead of Schedule

Daily Bullets (July 26): Eric Morris on Recruiting Challenge, Where BPS Ranks among Big 12 Stadiums

Daily Bullets (July 25): Best Point Guard Since Cade?

Oklahoma State Offers 2027 Receiver, JUCO Tackle

Oklahoma State Announces Bedlam Hoops Doubleheader Info

Oklahoma State Commit Tyson Pogi Shined in AAU This Summer
-
 Football5 days ago
We Simulated Oklahoma State’s 2026 Season 100 Times, Here’s What Happened
-
 Hoops5 days ago
‘A Whole Other Animal’: Steve Lutz on Navigating Lawsuits, Eligibility and NIL at Oklahoma State
-
 Hoops4 days ago
Cowboys’ Highly Touted Freshman Class and Slimmed Down Sophomores Signal Bright Future
-
 Football3 days ago
Oklahoma State Football Announces New Futuristic Partnership