
Football
Inside the Numbers: Oklahoma State Good (Not Great) Against Tech
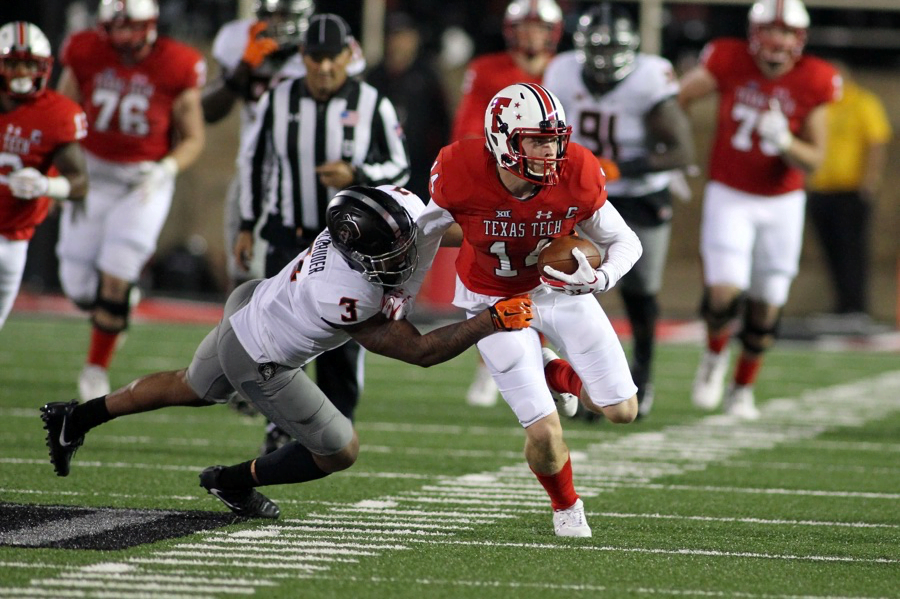
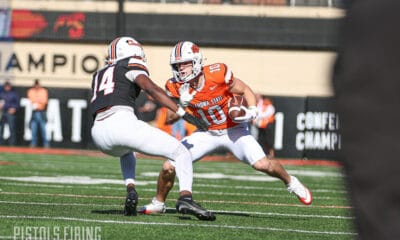
The numbers Oklahoma State put up against Texas Tech on Saturday should be equal parts encouraging and discouraging. On one hand, they got into Tech’s red zone 10 (!) times. On the other hand, they only got in the end zone on half of those.
Let’s take a look at how things played out on Saturday and see if there’s anything we can learn.
OSU Drive Chart
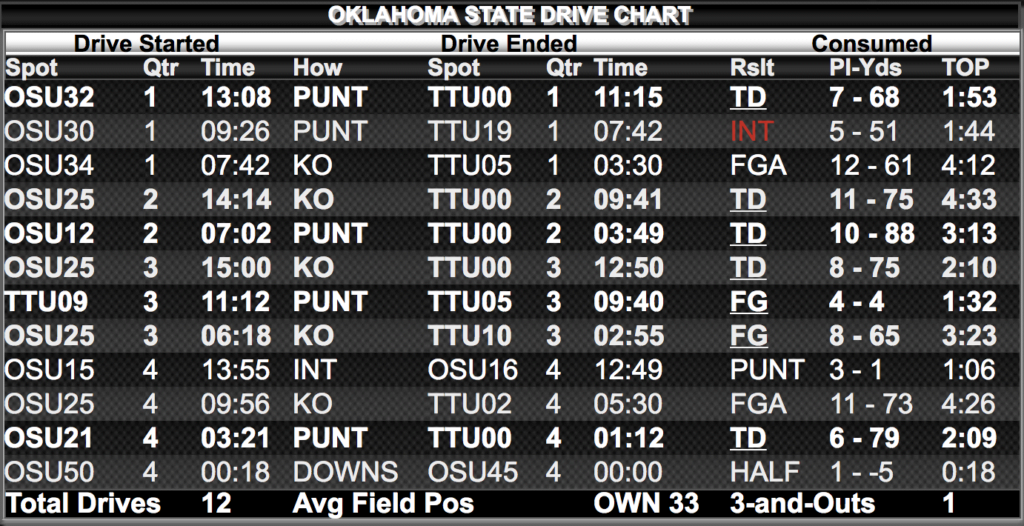
It’s really incredible to me that OSU only had one drive that ended on its side of the 50 and only punted one time. I know Tech’s defense yada yada yada, but that is really impressive. I also love seeing three double-digit play drives. Quick-strike bombs are maybe more viscerally appealing, but long, methodical, soul-sucking drives are what win games (and conferences).
OSU’s Pertinent Numbers
- Points per drive (offense): 3.42
- Points per drive (defense): 2.25
- Yards per play: 7.3
- Third-down conversions: 6/11 (55%)
- Average starting field position: own 33-yard line
- Red-zone scoring: 7/10
- Points off turnovers: 0
- Time of possession: 30:39
I wonder how many times in the last 10 years a team has thrown a pick-six in the first quarter and gone on to win. I can’t think that winning percentage is very high.
It’s hard to say who had a better day on Saturday between Mike Yurcich and Glenn Spencer. That 3.4 number on offense is quite solid (and it should have been much higher), but holding Tech to 2.25 points per drive at home at night? That’s excellent.
“I thought our defense played really well,” said Mike Gundy after the game. “You take away the pick-six. So you keep them, you’re holding them at 26 points or 25, whatever it is, out here, pretty good. We got room for improvement. But what we did is they were 5-of-12 on third down. So for us that’s a significant improvement. And so that’s a nice job. 0-for-1 on fourth and five-of-12 on third downs. And that’s a big jump for us.”
The 70 percent number on red zone scoring masks the fact that five of them didn’t end in TDs. Look at the yards per play. Look at the drives. Watch the tape. OSU dominated on the field on Saturday, but it didn’t show up on the scoreboard because they didn’t convert inside the red zone. That’s been an issue for most of Mason Rudolph’s career, and it’s an even bigger one right now. Two weeks to figure it out.
Now let’s look at Tech’s drive charts.
Tech Drive Chart
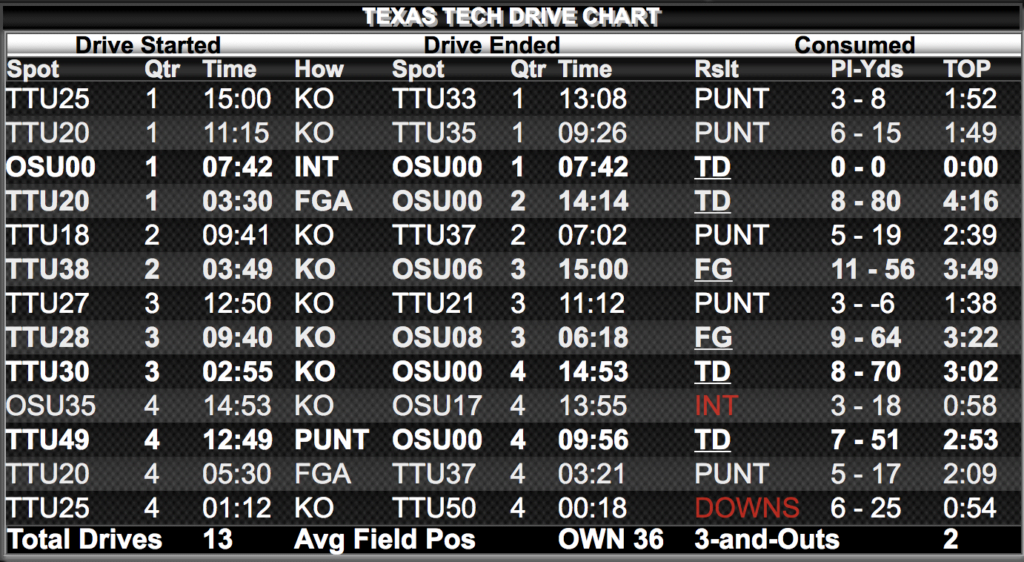
Carson Cunningham brought this up on the postgame show, but those final four drives from the Oklahoma State defense were so impressive. Two stops on downs and an INT against one TD. That’s big boy stuff with your season on the line late in a game on the road.
Tech’s Pertinent Numbers
- Points per drive (offense): 2.25
- Points per drive (defense): 3.42
- Yards per play: 5.3
- Third-down conversions: 5/12 (42%)
- Average starting field position: own 36-yard line
- Red-zone scoring: 5/6
- Points off turnovers: 7
- Time of possession: 29:21
Oklahoma State held Tech to two field goals and an INT in its six trips to the red zone. I know fans hate the bend but don’t break defense, but it actually worked pretty well on Saturday in Lubbock.
While we’re here, OSU out-gained TCU by over a yard per play and out-gained Tech by two. They are winning plays on the field, but it’s being mitigated by turnovers and penalties, which is obviously not good but could be an encouraging sign going into the future.


Eric Morris’ Coaching Staff Has More in Common with Contenders than Big 12 Newcomers

Player Rating Superlatives: A Look at the Fastest, Strongest Cowboys in EA Sports’ College Football 27

Steve Lutz Releases Statement on Kashie Natt’s Eligibility Pursuit

Oklahoma State’s Offense Well Represented on Big 12 All-Portal Team

Daily Bullets (July 1): Caleb Hawkins a (Preseason) All-American

Daily Bullets (July 5): Some Predix for OSU Football

Daily Bullets (July 4): Can the Defense Match the Offense, Happy 250th, America!

Texas Tech, Colorado Headline Big 12’s Top Defensive Portal Additions This Offseason

The Reload Ep. 53: World Cup Grass, Big 12 Media Days Preview

Daily Bullets (July 3): The All-Portal Pokes
-
 Football4 days ago
Eric Morris’ Coaching Staff Has More in Common with Contenders than Big 12 Newcomers
-
 Football4 days ago
Player Rating Superlatives: A Look at the Fastest, Strongest Cowboys in EA Sports’ College Football 27
-
 Hoops4 days ago
Steve Lutz Releases Statement on Kashie Natt’s Eligibility Pursuit
-
 Football3 days ago
Oklahoma State’s Offense Well Represented on Big 12 All-Portal Team