
Football
What We Can (and Can’t) Take from Sean Gleeson’s Production at Princeton
What the numbers tell us about the Cowboys’ new OC.
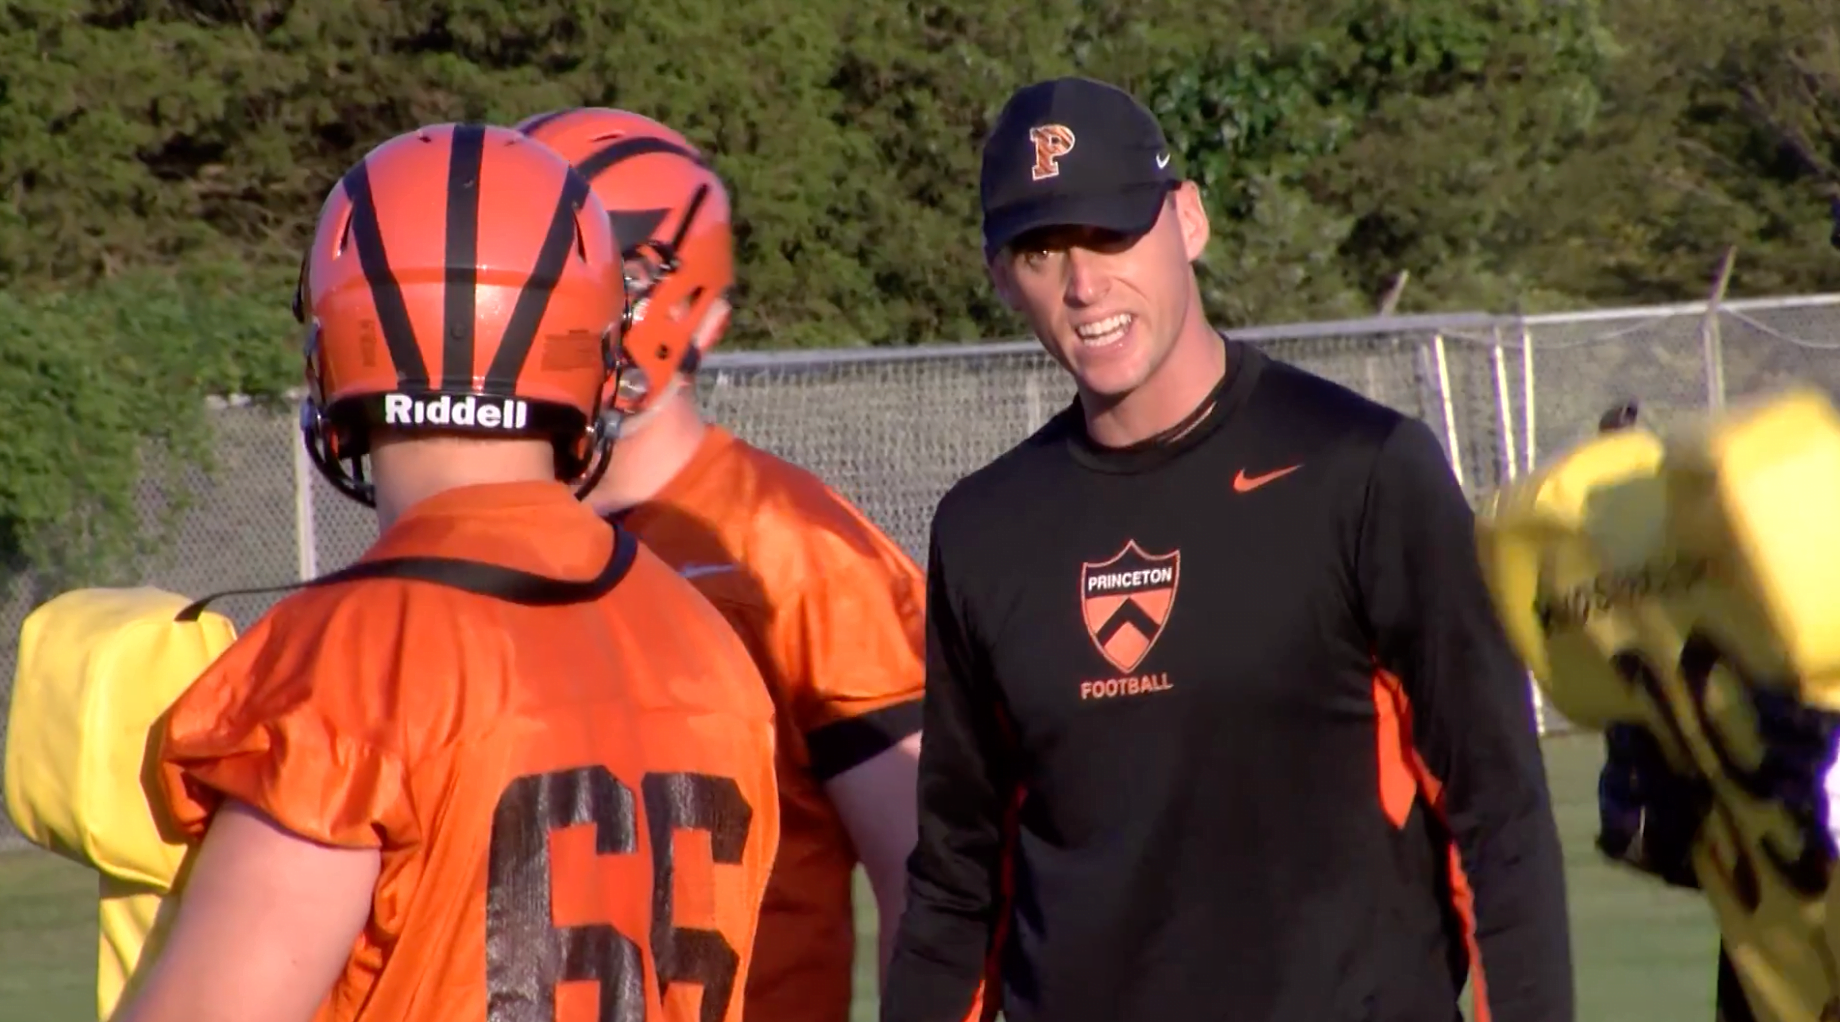
We’ve tried to cover the recent hire of Sean Gleeson from all angles. Kyle Porter has talked about the hire from a philosophical standpoint, Kyle Boone has predicted a boon in recruiting and Dustin Ragusa has started a series diving into Gleeson’s playbook at Princeton that you will definitely want to read.
But I thought I’d peek at some of the stats that his Princeton Tigers put up over his two years in between the headset — which is not always easy with an FCS team — to see what conclusions we could draw, if any, about how effectively and efficiently he runs an offense.
Let me say it here lest the comment section overflow with the obvious. Any comparison between Princeton’s numbers and OSU’s is a juxtaposition of two popular fruits. The Ivy League ≠ the Big 12 in skill or in stakes. It’s also important to understand that Gleeson’s sample size of two years is rather short. So take all of that into account when viewing this information. That being said, there’s plenty to like about what he was able to do on offense.
Passing Game
To make it in the Big 12, you have to be able to sling it, and Oklahoma State’s roster is built to do just that. There is a QB room full of upside and a talented corps. of wide receivers returning. It will be up to their new OC to get them in position to make plays.
What you’ll notice over his two years worth of numbers is that it was a tale of two offenses which, as has been pointed out, accentuates Gleeson’s ability to adapt to his personnel.
| Passing Stats | 2017 | FCS Rank | 2018 | FCS Rank |
|---|---|---|---|---|
| Passing Offense | 351.4 | 2 | 241.3 | 41 |
| TDs/INTs | 30/9 | — | 24/3 | — |
| Pass Efficiency | 166.7 | 3 | 161.3 | 7 |
| Sacks Allowed | 0.8 avg | 8 | 1.0 avg | T15 |
With the more polished pocket passer, Chad Kanoff, Gleeson fielded a prolific passing attack. Then, when he had a dual-threat QB in John Lovett, his Tigers were a much more run-heavy team.
Running Game
The Tigers went from an okay rushing team to a dominant one with their change in QBs. And as Bill Connelly pointed out on the PFB Podcast, the Tigers were blowing a lot of teams out late which led to some inflated rushing numbers.
| Rushing Stats | 2017 | FCS Rank | 2018 | FCS Rank |
|---|---|---|---|---|
| Rushing Offense | 131.6 | 80 | 295.5 | 6 |
| TDs/YPC | 20/4.0 | — | 40/6.5 | — |
Last year’s Tigers offense utilized a running back by committee approach — which can’t hurt when you’re trying to bring some young backs along like OSU will be — and saw its quarterback John Lovett lead the team in rushing (894 yards and 13 ground TDs in 10 games).
Total Offense, Scoring Offense
Regardless of whether it was on the ground or through the air, Gleeson’s teams were able to put up points and put up yards.
| Offense | 2017 | FCS Rank | 2018 | FCS Rank |
|---|---|---|---|---|
| Scoring Offense | 38.2 | 3 | 47 | 1 |
| Total Offense | 483.0 | 4 | 536.8 | 2 |
| Yards Per Play | 6.6 | 5 | 7.2 | 5 |
I was unable to procure our beloved points per drive date (again, I would hate to run a FCS blog), but these numbers speak for themselves. Gleeson’s groups put up points in bunches. The 470 total points last year set a school record.
Third and Fourth Downs, Penalties
Let’s take a look at how Gleeson’s offenses fared on the money down, fourth downs and when it came to those pesky penalties.
| Money Down(s), Flags | 2017 | FCS Rank | 2018 | FCS Rank |
|---|---|---|---|---|
| 3rd Down % | 48.3% | 120 | 53.4% | 2 |
| 4th Down % | 52.4% (11/21) | 41 | 82.6% (19/23) | 2 |
| Penalties | 3.9 avg | 6 | 4.3 avg | 6 |
| Penalty Yards | 39.9 avg | 7 | 38.7 avg | T9 |
I lumped third-down conversions and penalties together because they both can make or break an offense. I added fourth downs because they’re kinda fun. For reference, OSU converted 44.9 percent of its third downs last year, good for 23rd in the FBS.
Gleeson’s teams (offense and defense) showed a knack for staying out of trouble — something OSU struggled mightily with last season. OSU’s 70.5 penalty yards per game ranked T115th in 2018 and the Cowboys were flagged an average of 6.8 times per game.
On third downs, the Tigers showed marked improvement from his first year to his season, leaping from No. 120 in third-down percentage all the way up to No. 2 in the FCS.
And his fourth-down attempts show a playcaller who, at least at Princeton, wasn’t afraid to trust his offense and go for it. Maybe that changes when he gets to Stillwater Mike Gundy is making those calls in Year 1.
Red Zone Offense
In each of Gleeson’s years, Princeton came in ranked No. 6 in the FCS in red-zone scoring percentage. Oklahoma State scored on 89.6 percent of its score zone trips, ranked 19th last year.
| Red Zone | 2017 | 2018 |
|---|---|---|
| RZ % | 47/52 (90.4%) | 51/59 (86.4%) |
| RZ Rush TDs | 18 | 29 |
| RZ Pass TDs | 22 | 14 |
| RZ FGs | 7 | 8 |
| PPR | 5.8 | 5.5 |
Good offenses at least get something when they get deep into enemy territory — really good offenses score touchdowns. Gleeson was adept at getting into the end zone instead of settling for 3, and he used his touted ingenuity — sometimes employing up to three QBs at once — to pay off those long drives with 7 points.
That’s where our PPR (points per red-zone attempt) stat comes in. Gleeson’s Princeton offenses turned in PPRs of 5.8 and 5.5. Here are Mike Yurcich’s at OSU:
2013 — 5.6
2014 — 4.7
2015 — 5.4
2016 — 5.1
2017 — 5.3
2018 — 5.4
Not a huge difference, but it’s obviously something he’s been proficient at, and apparently isn’t afraid to think out of the box to excel in.
Odds and Ends
Here are just a few things that I found somewhat interesting while perusing Princeton’s production.
Turnovers — From Year 1 to Year 2, Gleeson figured some things out in the turnover department. In 2017 the Tigers gave it away 17 times (eight interceptions and nine lost fumbles) which ranked 41st in the FCS. Last year they only gave up six TOs (three INTs and fumbles each) which ranked No. 1.
Going for 2 — In 2017, Princeton completed three 2-point conversions followed by just one in 2018.
TFLs — The Tigers O-line only allowed 3.6 tackles for loss per game in 2017 (second in FCS) and 3.3 per game in 2018 (third in FCS). That meshes with the lock sack numbers referenced above.
Again, we’ll have to wait and see how his impressive production in just two years as an FCS playcaller translates after a big step up in talent and expectations. But these numbers at least frame a decent argument for Gundy once again trolling for big fish in a smaller pond.


Oklahoma State Wins All-Sports Bedlam for Sixth Time in Last Seven Years

Cowgirl Hoops: Which Oklahoma State Players Could Surprise This Season

Three-Star Running Back TJ Lewis Commits to Oklahoma State

Report: Kashie Natt Files Lawsuit Against NCAA Seeking Eligibility

Viktor Hovland Outlasts Scottie Scheffler to Win Traveler’s Championship

Daily Bullets (July 1): Caleb Hawkins a (Preseason) All-American

Oklahoma State Running Back Caleb Hawkins Named Walter Camp Preseason All-American

Daily Bullets (June 30): Hovland Wins, Pokes Win Bedlam Cup
Report: Kashie Natt Files Lawsuit Against NCAA Seeking Eligibility

Fixing the Group of Five: A Fun Idea to Bring Promotion-Relegation to College Football
-
 Baseball2 days ago
Oklahoma State Wins All-Sports Bedlam for Sixth Time in Last Seven Years
-
 Hoops5 days ago
Cowgirl Hoops: Which Oklahoma State Players Could Surprise This Season
-
 Football4 days ago
Three-Star Running Back TJ Lewis Commits to Oklahoma State
-
 Hoops2 days ago
Report: Kashie Natt Files Lawsuit Against NCAA Seeking Eligibility