
Hoops
How Full Was Each Big 12 Basketball Arena Last Year?
Like I said in my original post highlighting OSU’s woeful attendance for the 2014-15 basketball season, there are a million ways to look at attendance in college athletics.
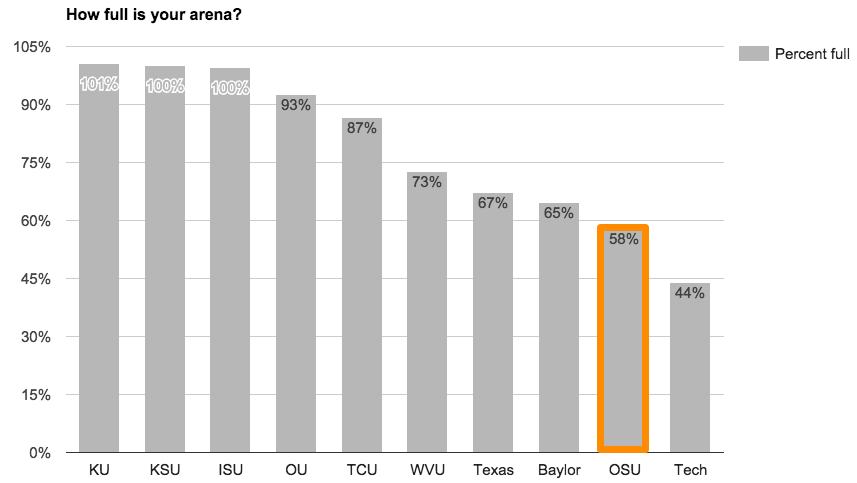
We already saw how OSU is trending compared to the Big 12 and NCAA in general (not good!), but what about as a percentage of filling up your arena?
Isn’t that probably the best way to see what a healthy basketball program looks like, all things being equal? Duke doesn’t draw a quarter of what Kentucky draws but nobody argues that those two programs aren’t equal.
So I pulled the capacities (here, I used the HS gym TCU played in for its attendance) and compared them to reported ticket sales.
Here’s what that looked like:
Again, not good!
Kansas, Kansas State and Iowa State all reported averaging a sellout every game. OU, TCU and West Virginia all had over 70 percent capacity (although, again, TCU’s capacity was barely larger than my high school gym for the 14-15 season and I’m guessing they sold tickets as if they were playing in the big boy gym).[1. In other words, Morton doesn’t sell enough salt for you to take with you.]
Oklahoma State and Texas Tech are bringing up the bottom of the Big 12 with ugly 58 percent and 44 percent numbers respectively.
Now, it should be noted that these numbers can be, um, inflated. Nobody thinks that Lloyd Noble was 93 percent full on average. But you know who doesn’t much care about that? Everyone in their athletic department counting the money that comes with selling 93 percent of possible tickets on average.
I’m not trying to beat a dead horse here (DeAndre jokes sold separately). I’m simply bummed out about the trajectory of Oklahoma State’s program. Any way you look at it (financially, statistically or even futuristically), this is a program embroiled in mediocrity. Expensive mediocrity at that.


Cowgirl Hoops: 6-foot-7 European Center Mojca Jelenc Signs with Oklahoma State

Audi Crooks Decided to Become a Cowgirl After Jacie Hoyt Confronted Her with Lowlight Reel

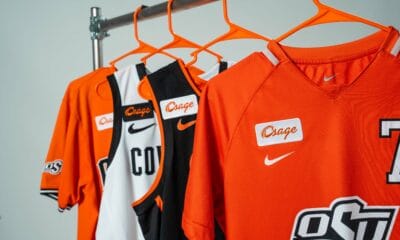
Oklahoma State, Osage Nation Partnering with Jersey Patch Sponsorship

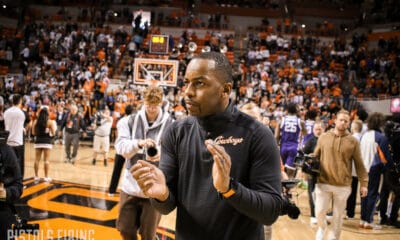
Report: Mike Boynton to Become Michigan’s Interim Coach

NCAA to Incorporate ‘Five-for-Five’ Eligibility Model, Which OSU Team It Could Affect the Most

Three-Star Running Back TJ Lewis Commits to Oklahoma State

Cowgirl Hoops: Which Oklahoma State Players Could Surprise This Season

Big 12 Media Days Attendees Revealed

Daily Bullets (June 26): Pundits Waving the OSU Flag as a Dark Horse Pick

Cowgirl Softball: Ole Miss Transfer Pitcher Payton Kennedy Commits to Oklahoma State
-
 Hoops5 days ago
Cowgirl Hoops: 6-foot-7 European Center Mojca Jelenc Signs with Oklahoma State
-
 Hoops4 days ago
Audi Crooks Decided to Become a Cowgirl After Jacie Hoyt Confronted Her with Lowlight Reel
-
 Football4 days ago
Oklahoma State, Osage Nation Partnering with Jersey Patch Sponsorship
-
 Hoops5 days ago
Report: Mike Boynton to Become Michigan’s Interim Coach