
Football
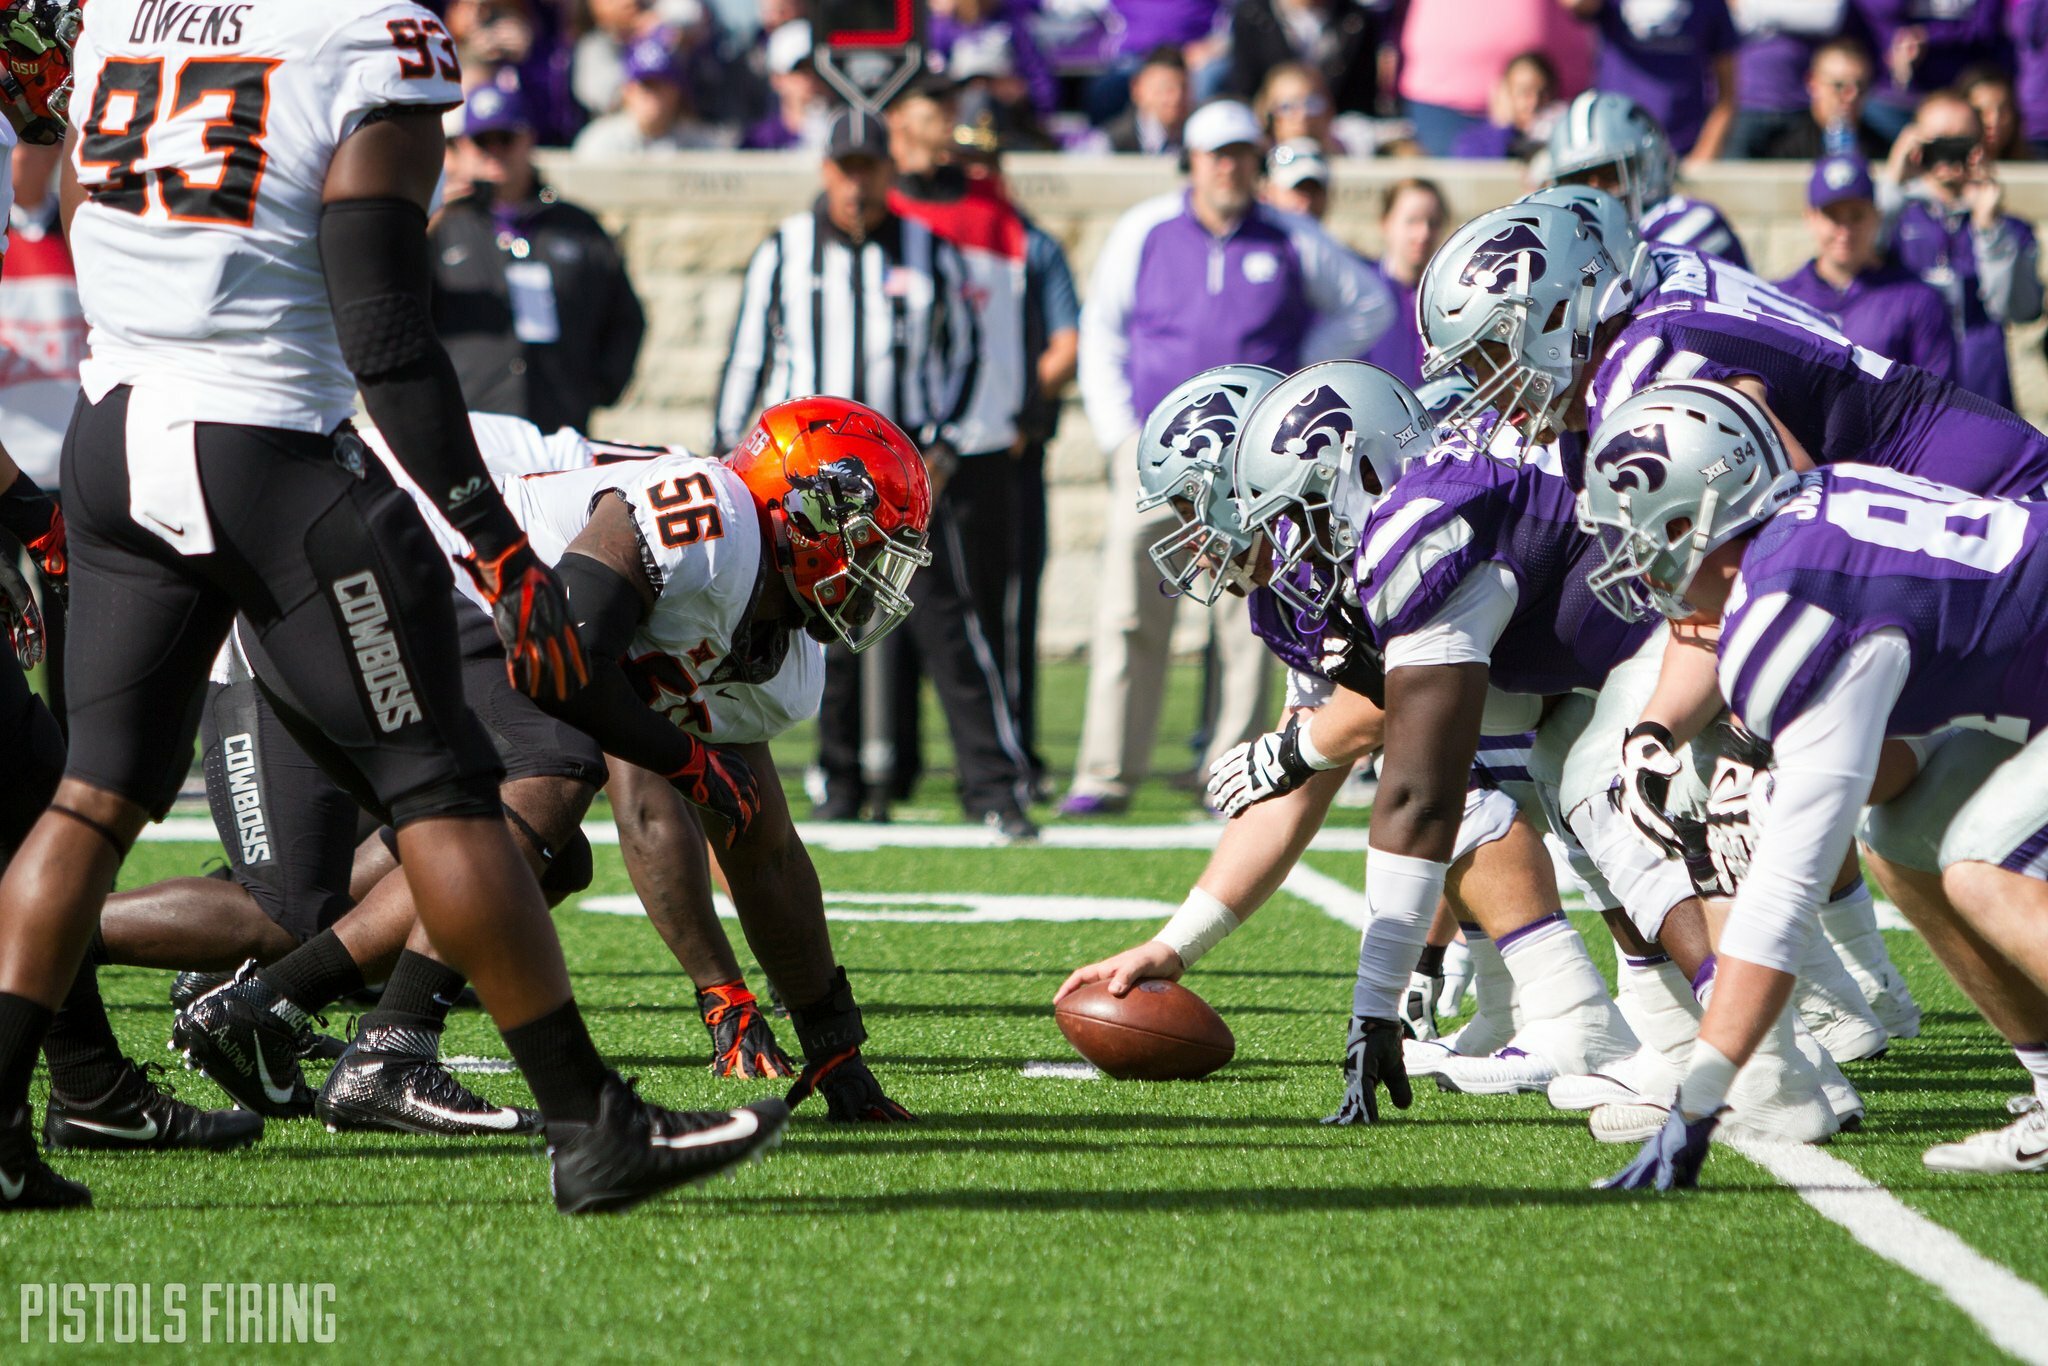
Intro to Charlie Dickey: How OSU’s New Offensive Line Coach Fared at K State
A look at how nasty Dickey’s front lines were with the Wildcats.
There are no foolproof stats to determine how good an offensive line is, but here goes nothing.
The Josh Henson to Charlie Dickey switch at Oklahoma State came quick. Dickey’s road to Stillwater was much less brisk. Dickey, a former member of the Pittsburgh Steelers, has spent 28 of the past 29 seasons as an offensive line coach, the only break coming in 2003 when he coached Arizona’s tight ends.
As I said before, offensive line stats aren’t always a perfect science, but the two I decided to look at are sacks allowed and rushing yards per carry. We’ll get the issues with both out of the way first. With sacks, numbers can be a bit skewed depending on the offenses style, meaning if a team throws the ball a lot less than others, there are less opportunities to get sacked. Yards per carry has a lot to do with offensive lines, but it also has to do with particular running backs’ skills.
I didn’t go all the way back to Dickey’s time at Scottsdale Community College. I stopped at Dickey’s lone season with Washington in 2004, primarily because that’s where ESPN’s statistics stopped me.
So with that out of the way, let’s looks at Dickey’s O-Line’s sacks allowed first. Keep in mind on this chart, it’s better to have a low number.
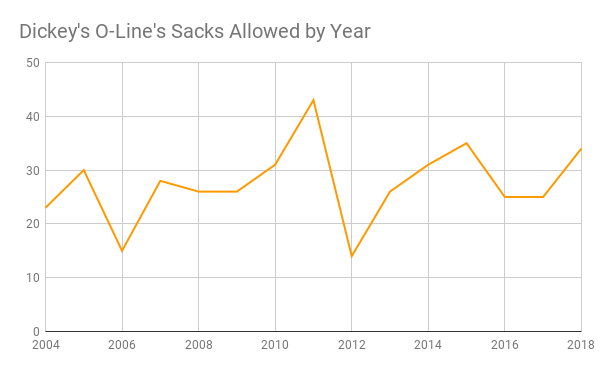
2018 wasn’t a great year for K-State’s pass protection. The Wildcats’ 34 sacks allowed was the third most a Dickey O-Line has given up since 2004. That was tied with OSU for eighth in the Big 12, but it looks significantly worse considering the Wildcats’ 290 pass attempts were 73 fewer than anyone else in the Big 12. K-State allowed 25 sacks in 2017 and 2016, ranking fifth and second in the Big 12, respectively.
Here’s how Dickey’s offensive lines have done in terms of yards per carry.
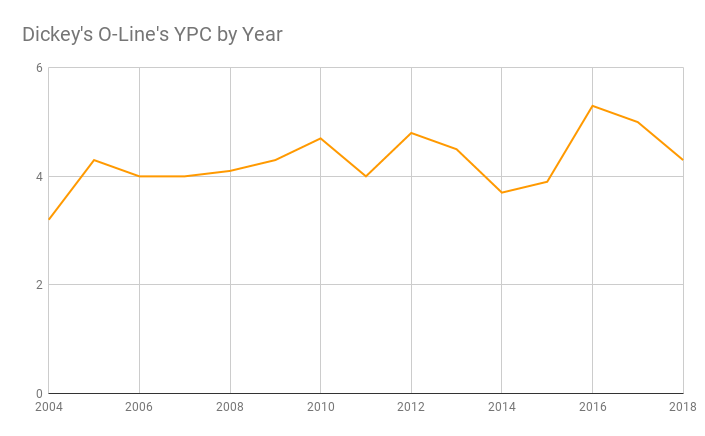
In Dickey’s 10 seasons at Kansas State, Wildcat runners have averaged 4.5 yards a carry, peaking at 5.3 in 2016. In 2017 and 2016, Kansas State’s offensive lines ranked second in the Big 12 each year in yards per carry.
Here’s a year-by-year chart of all the stats I used.
| Year | School | Sacks Allowed | Conference Rank | Rushing Yards Per Carry | Conference Rank |
|---|---|---|---|---|---|
| 2018 | Kansas State | 34 | T8 | 4.3 | 6 |
| 2017 | Kansas State | 25 | T5 | 5 | 2 |
| 2016 | Kansas State | 25 | T2 | 5.3 | 2 |
| 2015 | Kansas State | 35 | 7 | 3.9 | 8 |
| 2014 | Kansas State | 31 | T8 | 3.7 | 8 |
| 2013 | Kansas State | 26 | 6 | 4.5 | 3 |
| 2012 | Kansas State | 14 | 2 | 4.8 | 5 |
| 2011 | Kansas State | 43 | 10 | 4 | 8 |
| 2010 | Kansas State | 31 | 9 | 4.7 | 4 |
| 2009 | Kansas State | 26 | 6 | 4.3 | 4 |
| 2008 | Utah | 26 | T8 | 4.1 | 7 |
| 2007 | Utah | 28 | 5 | 4 | 2 |
| 2006 | Utah | 15 | 1 | 4 | 4 |
| 2005 | Utah | 30 | 8 | 4.3 | 3 |
| 2004 | Washington | 23 | 2 | 3.2 | 8 |


Oklahoma State’s Top 5 Wins of the Bob Simmons Era

Three-Star Texas Wide Receiver Ake O’Neal Commits to Oklahoma State

Cowboy Hoops: Big 12 Releases Oklahoma State’s Conference Pairings for 2026-27 Season

Steve Lutz Leaned More Heavily on Personality Test When Constructing Oklahoma State’s Roster

OSU Softball: Houston Two-Way Transfer Madison Hartley Commits to Oklahoma State

OSU Baseball: Morehead State Transfer Aubrey Kearns Commits to Cowboys

Daily Bullets (June 15): Pokes Add Southeastern Lineman, Eric Morris Among Peers

Oklahoma State Lands Three-Star 2027 OL Jake Baker

Daily Bullets (June 14): Kenny Gajewski, Josh Holliday Each Land Big 12 Transfers on Saturday

OSU Baseball: Utah Transfer Pitcher Kaden Soder Commits to Oklahoma State
-
 Football5 days ago
Oklahoma State’s Top 5 Wins of the Bob Simmons Era
-
 Football4 days ago
Three-Star Texas Wide Receiver Ake O’Neal Commits to Oklahoma State
-
 Hoops4 days ago
Cowboy Hoops: Big 12 Releases Oklahoma State’s Conference Pairings for 2026-27 Season
-
 Hoops4 days ago
Steve Lutz Leaned More Heavily on Personality Test When Constructing Oklahoma State’s Roster