
Football
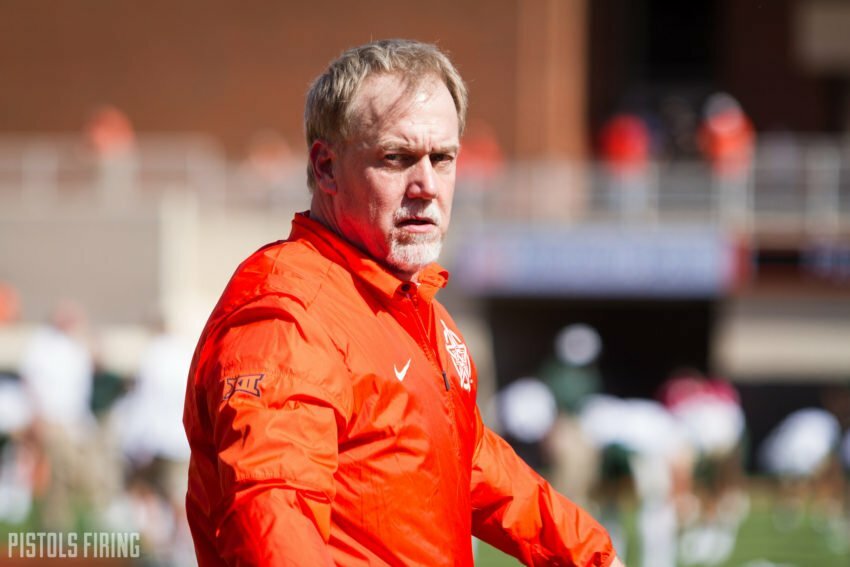
OSU’s 3rd-Down Defense Under Glenn Spencer Has Been … Not Good Enough
As an Oklahoma State fan, one of the biggest complaints we have on a yearly, if not weekly basis, is the team’s inability to get off the field on 3rd downs.
So far this year, it’s a legitimate concern. OSU’s 3rd-down defense is currently ranked 113th in the country, allowing a 45 percent completion rate. Granted, OSU has faced three teams in the top 40 on 3rd-down completion percentage, including No. 1 TCU which averages 58 percent.
But this isn’t just an issue this year, it’s been a complaint OSU fans have had for most of defensive coordinator Glenn Spencer’s tenure. But is it really an issue or just a perceived one?
Since Spencer took over for the 2013 season, OSU’s 3rd-down defensive percentage is 39 percent. For the sake of comparison, that’s the same as OU over the same stretch. Year by year, if the 2017 season ended today, 45 percent would be the worst under Spencer.
2013 – 31% – 7th nationally
2014 – 44% – 76th
2015 – 42% – 92nd
2016 – 38% – 61st
2017 – 45% – 113th
The worst year was so far, not surprisingly, 2014. The offense was so bad the defense was exhausted by the end of games and thus gave up long drives.
The other thing that we all feel happens all the time is OSU giving up 3rd and longs. For this I looked at every 3rd-down completion of six yards or more during this stretch and, surprisingly, it wasn’t horrible.
2013 – 22
2014 – 30
2015 – 31
2016 – 21
That’s a total of 104 over a four year span. At 52 games played, that averages out to exactly two a game, which isn’t great, but isn’t as bad as I thought it was. The two worst years were the same as the two years with higher third down percentages.
Here’s the thing though, I thought those numbers would all be worse. A lot worse. Fans, myself included, always seem to lament during and after games the number of third downs and third-and-longs that OSU gives up. There were times it felt like OSU’s best season would have been in the mid to upper 40s. That 2014’s was only 44 percent is kind of astounding.
And honestly, going through everything, as long as OSU holds a team to a 50 percent 3rd down completion or less, the Cowboy likely come out winners.
OSU’s record when holding a team under 50% completion: 32-7
OSU’s record when a team has higher than 50% completion: 6-8
I went into this expecting to be able to tear into Glenn Spencer … and I still want to. I think fans have given him a pass ever since 2013. That was a great defense, and we all loved watching Spencer’s animated personality on the side lines. But that was four years ago, and despite last year’s defense showing improvement, it’s time to face the fact that Glenn Spencer is probably a little bit overrated.
But his 3rd-down defense hasn’t been that bad.
Look, I get as frustrated as all of you see OSU give teams a 10 yard cushion on a 3rd-and-9. I’m not sure that’s entirely Spencer’s fault. Coach Gundy’s fear of giving up the big play allows teams to yard-chunk their way down the field too easily at times, especially when there’s a good quarterback.
At the same time, OSU is not recruiting Alabama’s defense anytime soon. And if you haven’t watched SEC football lately, there are much more powerful and dynamic offenses in the Big 12. Heck, there are much more dynamic offenses in the Big 10 at this point!
But it always feels like on a third-and-long OSU gives teams just enough space to get the first down and doesn’t put enough pressure on the quarterback.
Maybe that’s changing with the looks OSU threw at Baylor. Maybe not.
Another thing that really sticks out to me though, is if you look at the game-by-game breakdown, is how often OSU holds its opponent to under their season average on 3rd down completions (see charts below). That’s usually a good indicator of how good the team is. In 2013, OSU held 10 of it’s 13 opponents under their season average. In 2014 it was six teams, in 2015 it was five. Last year was a real improvement, with eight opponents held under their average.
This year? OSU has held two teams under their season average (South Alabama and Texas Tech) and one to their average (Pitt). TCU, Baylor, and Tulsa all went over. Granted, TCU is No. 1 in the nation and Tulsa is No. 11, but OSU still has Texas (No. 12) and Oklahoma (No. 31) on the schedule.
I almost convinced myself I was overreacting too all of this, and that I should just go back to believing in the system … until I looked up one more thing: OSU’s 3rd-down defensive completion percentage the last three years of Bill Young’s tenure as defensive coordinator:
2010 – 43% – 98th
2011 – 42% – 81st
2012 – 36% – 32nd
(Can you imagine what OSU could have done if they hadn’t had to play musical quarterbacks in 2012 and 2013?!)
The 3rd down defense is frustrating to watch, but it has been better than we’ve thought … in the past. This year though? So far, it’s not been good enough to win a Big 12 title, forget a national championship. Of all the years, and with the level of expectation coming into the season, this is NOT the year for Spencer’s defense to have its worst 3rd-down percentages (overall and on a game-to-game basis). Yet, here we are.
This year the Cowboys have one of the best offenses to ever take the field in orange and black. If they can’t win the Big 12 title with this 3rd down defensive philosophy this year, they might never be able to do it.
I’m not by any means saying Spencer’s got to go (you can look at other numbers and actually say he’s been terrific), but there does need to be some sort of change in philosophy or execution on third downs for the rest of the year.
2013
| Team | Completions | Percentage | Opposing team season % | 6+ yd |
|---|---|---|---|---|
| vs. Mississippi State | 2-16 | 12.5% | 39% | 2 |
| @ UTSA | 6-14 | 43% | 45% | 3 |
| Lamar | 7-23 | 30% | 42% | 3 |
| @ West Virginia | 8-22 | 36% | 32% | 4 |
| Kansas State | 5-12 | 42% | 49% | 2 |
| TCU | 6-17 | 35% | 32% | 2 |
| @ Iowa State | 4-20 | 20% | 34% | 0 |
| @ Texas Tech | 4-15 | 26% | 45% | 1 |
| Kansas | 5-20 | 25% | 28% | 0 |
| @ Texas | 10-19 | 52% | 41% | 1 |
| Baylor | 7-18 | 39% | 47% | 1 |
| Oklahoma | 2-15 | 13% | 39% | 0 |
| vs. Missouri | 6-18 | 33% | 44% | 3 |
2014
| Team | Completions | Percentage | Opposing team season % | 6+ yd |
|---|---|---|---|---|
| vs. Florida State | 4-14 | 28% | 46% | 2 |
| Missouri State | 4-14 | 28% | – | 1 |
| UTSA | 3-17 | 17% | 28% | 1 |
| Texas Tech | 8-16 | 50% | 44% | 4 |
| Iowa State | 10-20 | 50% | 42% | 2 |
| @ Kansas | 4-18 | 22% | 34% | 2 |
| @ TCU | 7-15 | 46% | 43% | 2 |
| West Virginia | 9-18 | 50% | 42% | 3 |
| @ Kansas State | 5-12 | 42% | 46% | 1 |
| Texas | 11-19 | 58% | 34% | 4 |
| @ Baylor | 7-14 | 50% | 47% | 3 |
| @ Oklahoma | 8-17 | 47% | 40% | 2 |
| vs. Washington | 4-12 | 33% | 41% | 3 |
2015
| Team | Completions | Percentage | Opposing team season % | 6+ yd |
|---|---|---|---|---|
| @ Central Michigan | 8-18 | 44% | 44% | 2 |
| Central Arkansas | 2-15 | 13% | – | 1 |
| UTSA | 7-17 | 41% | 41% | 3 |
| @ Texas | 4-16 | 25% | 35% | 2 |
| Kansas State | 4-11 | 36% | 39% | 3 |
| @ West Virginia | 6-20 | 30% | 39% | 1 |
| Kansas | 5-16 | 31% | 37% | 3 |
| @ Texas Tech | 10-17 | 59% | 52% | 6 |
| TCU | 9-19 | 47% | 43% | 3 |
| @ Iowa State | 6-13 | 46% | 40% | 1 |
| Baylor | 14-22 | 63% | 47% | 2 |
| Oklahoma | 8-14 | 57% | 44% | 1 |
| vs. Ole Miss | 6-13 | 46% | 41% | 3 |
2016
| Team | Completions | Percentage | Opposing team season % | 6+ yd |
|---|---|---|---|---|
| SE Louisiana | 1-12 | 8% | – | 0 |
| Central Michigan | 8-15 | 53% | 42% | 2 |
| Pittsburgh | 4-18 | 22% | 45% | 0 |
| @ Baylor | 6-12 | 50% | 42% | 1 |
| Texas | 6-16 | 38% | 36% | 0 |
| Iowa State | 7-17 | 41% | 43% | 3 |
| @ Kansas | 5-14 | 36% | 34% | 2 |
| West Virginia | 8-16 | 50% | 43% | 5 |
| @ Kansas State | 5-13 | 38% | 45% | 1 |
| Texas Tech | 8-17 | 47% | 52% | 1 |
| @ TCU | 6-16 | 38% | 41% | 2 |
| @ Oklahoma | 6-13 | 46% | 51% | 1 |
| vs. Colorado | 6-16 | 38% | 45% | 3 |


Report: OSU Defensive Tackle Iman Oates Granted Temporary Restraining Order against NCAA

Five Thoughts on Oklahoma State’s Final Game in Puerto Rico

Five Dominant 2025 Performances That Highlight Oklahoma State Defenders to Watch in 2026

Five Takeaways from Oklahoma State’s Three Games in Puerto Rico

2027 Edge Rusher Jayden Vessell Commits to Oklahoma State

Daily Bullets (Aug. 3): Weigh in on OKC Dave’s Survey, Halloween in Ames

Dave Hudson’s 2026 OSU Football Fan Survey Is Live

Daily Bullets (Aug. 2): It’s Training Camp Week

Daily Bullets (Aug. 1): Life as Golf Bluebloods, Bet on Skill Talent?

Breaking Down Oklahoma State’s 2027 Recruiting Class So Far
-
 Football5 days ago
Report: OSU Defensive Tackle Iman Oates Granted Temporary Restraining Order against NCAA
-
 Hoops5 days ago
Five Thoughts on Oklahoma State’s Final Game in Puerto Rico
-
 Football5 days ago
Five Dominant 2025 Performances That Highlight Oklahoma State Defenders to Watch in 2026
-
 Hoops4 days ago
Five Takeaways from Oklahoma State’s Three Games in Puerto Rico