
Football
Oklahoma State-Iowa State Drive Charts and a PPD Update
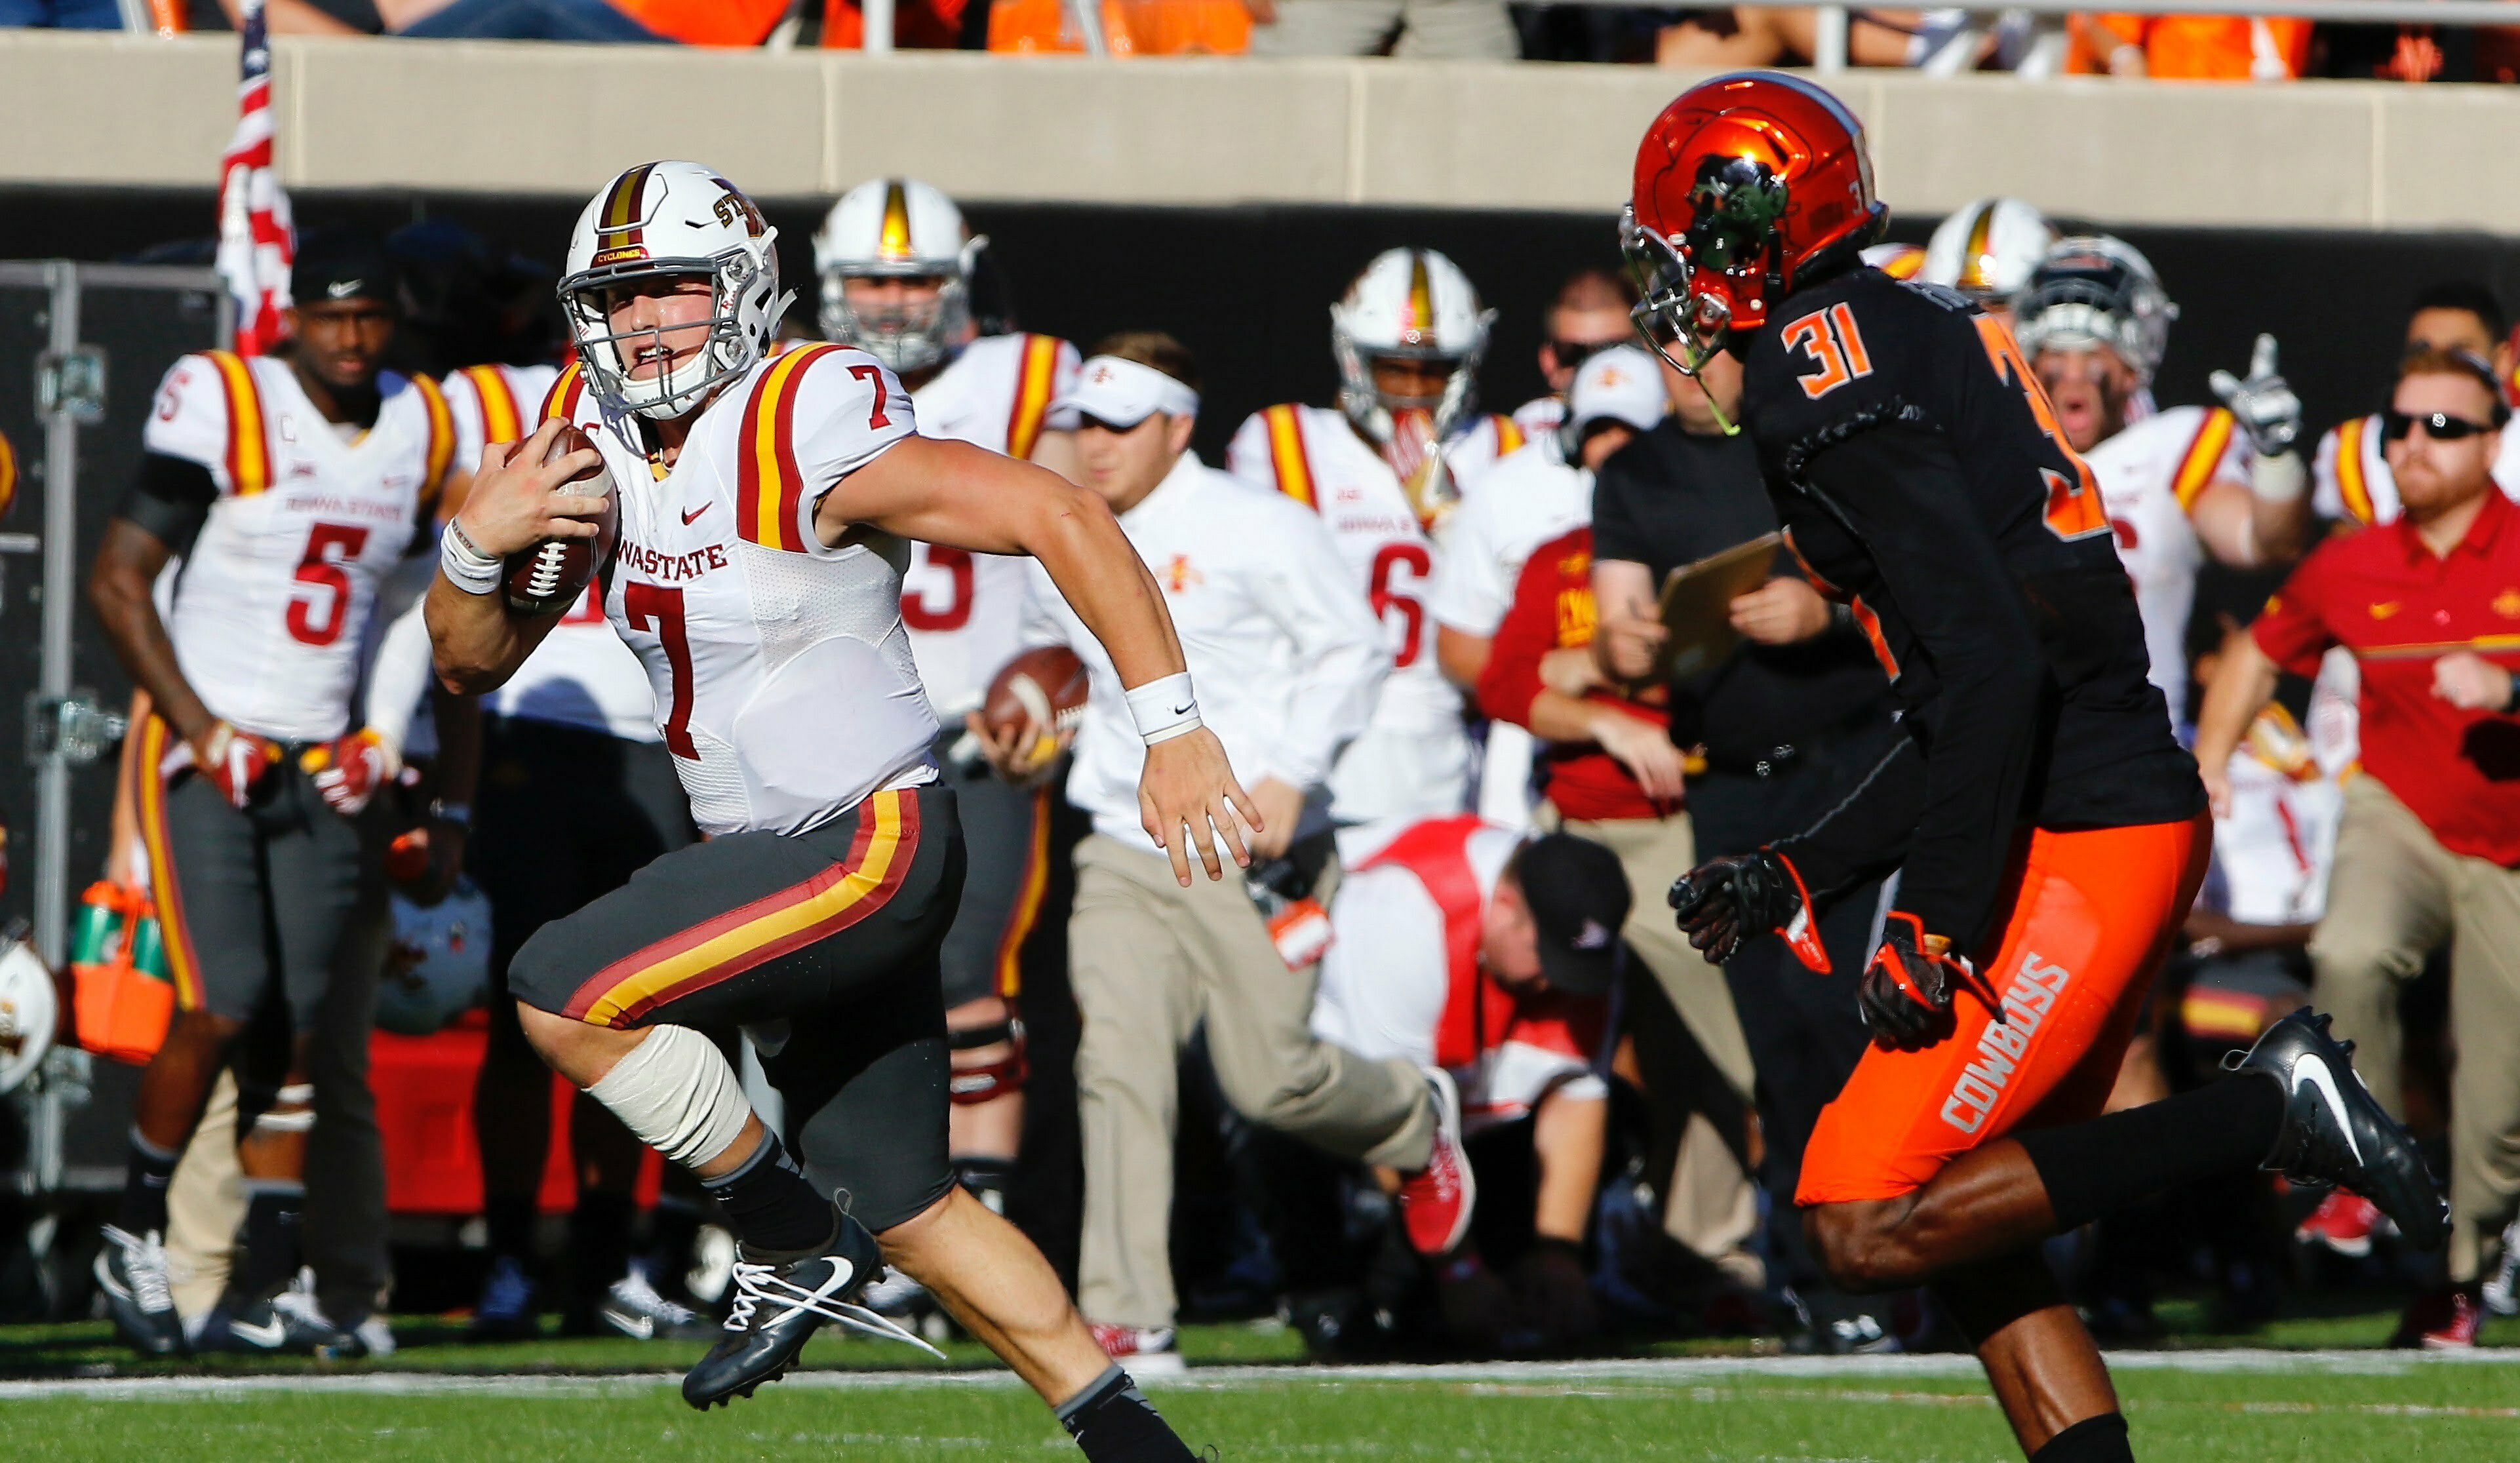
We haven’t tried this exact trope on the blog before, but you guys all know how big I am on drives and points per drive. So let’s take a quick look back at the Iowa State-Oklahoma State game to see how both teams fared on their drives. First up, Iowa State.
Iowa State
- Punt
- Field goal
- Punt
- TD
- INT
- TD
- TO on downs
- TD
- Punt
- TD
- Punt
- Fumble
- Punt
- INT
- Punt
- TO on downs
- End of half
If you count the last possession (and we probably should given that ISU was trying to score) then Oklahoma State held Iowa State to 1.82 points per drive and created three turnovers. That’s good against any Big 12 team but especially good against an ISU team that came in averaging 2.36 points per drive.
“Defensively we made a down-front adjustment in the fourth quarter with their running game,” said Mike Gundy after the game. “It was a good win for us. The guys learned how to fight back. We did that before. Mason Rudolph played average and missed some throws. When you miss throws and you get behind the chains, it’s hard to make it up.”
Now a look at OSU.
Oklahoma State
- Punt
- TD
- Punt
- Punt
- TD
- Punt
- TO on downs
- Punt
- Punt
- Punt
- TD
- TD
- FG
- Punt
- TD
- Punt
That is 2.38 points per drive which is slightly below OSU’s average on the season but way below the 3.46 points Iowa State was allowing per drive coming into the game. Think about how much changed in the last six possessions both ways too. If you look at the first 11 possessions, OSU was averaging 1.27 points per drive (NOT GOOD) and allowing 2.81 (ALSO NOT GOOD). It also helps that OSU didn’t turn the ball over.
This doesn’t tell the full story, but it does give you a better feel for the flow of the game (which ESPN captured nicely here).
This is insane. pic.twitter.com/YOBgtveO86
— Pistols Firing (@pistolsguys) October 8, 2016
Here is an update on OSU’s season numbers in the points per drive category.
- Offense: 2.55 scored (No. 35 nationally)
- Defense: 2.26 allowed (No. 73 nationally)
- Net: 0.29 (No. 46 nationally)
Teams just ahead of OSU in the net category include OU and Tulsa. Teams just behind OSU in the net category include Wake Forest, Cal, Penn State and Pittsburgh. Washington is No. 1 nationally with a net of 2.92 points per drive. Lunacy.


UCF Transfer Jordan Burks Commits to Oklahoma State

Oklahoma State Softball Unable to Survive Fifth Inning Surge, Jordy Frahm in Season-Ending Loss

Broken Arrow Defensive Back Bryson Brown Commits to Oklahoma State

What Vegas Odds Say about Oklahoma State’s 2026 Football Schedule

‘Country Strong’: After Breaking Out at Last Season’s Regional, Kollin Ritchie Enters This Postseason as the Cowboys’ Star

Daily Bullets (May 28): Ladies and Gentlemen, We Have Kick Times

Could Congress Force Bedlam Football to Return?

Kick Times for Oklahoma State’s Nonconference Games Announced

OSU Wrestling: Cowboys Sending Big Group to Ohio for U20 World Team Trials, U23 Nationals

Daily Bullets (May 27): Kollin Ritchie’s Rise After Regional Breakout, Terry Don Phillips Passes Away
-
 Hoops5 days ago
UCF Transfer Jordan Burks Commits to Oklahoma State
-
 Softball5 days ago
Oklahoma State Softball Unable to Survive Fifth Inning Surge, Jordy Frahm in Season-Ending Loss
-
 Football5 days ago
Broken Arrow Defensive Back Bryson Brown Commits to Oklahoma State
-
 Football3 days ago
What Vegas Odds Say about Oklahoma State’s 2026 Football Schedule