Football
PF Defense: Pokes Finish Top Four in Big 12, but Far Behind Top Three

We have collected all 1,272 drives from the 2017 Big 12 season for evaluation, and we already looked at what those numbers say about Big 12 offenses. Today, let’s look at the defensive side of the ball with a stat I’m calling PF Defense.
This stat takes how many points you’re expected to give up against the Big 12 defenses you faced based on the number of drives you faced and meshes that with how many points you actually gave up.
In 2017, the average points scored on a Big 12 drive was 2.14. That’s 324 TDs and 125 FGs on 1,236 non-zero play drives.
Let’s rank the teams by their PF Defense per game. That is, if an average Big 12 offense got 10 drives in a game, it would be expected to score 21.4 points on an average Big 12 defense. This chart answers the question of how much better or worse your defense was than that.
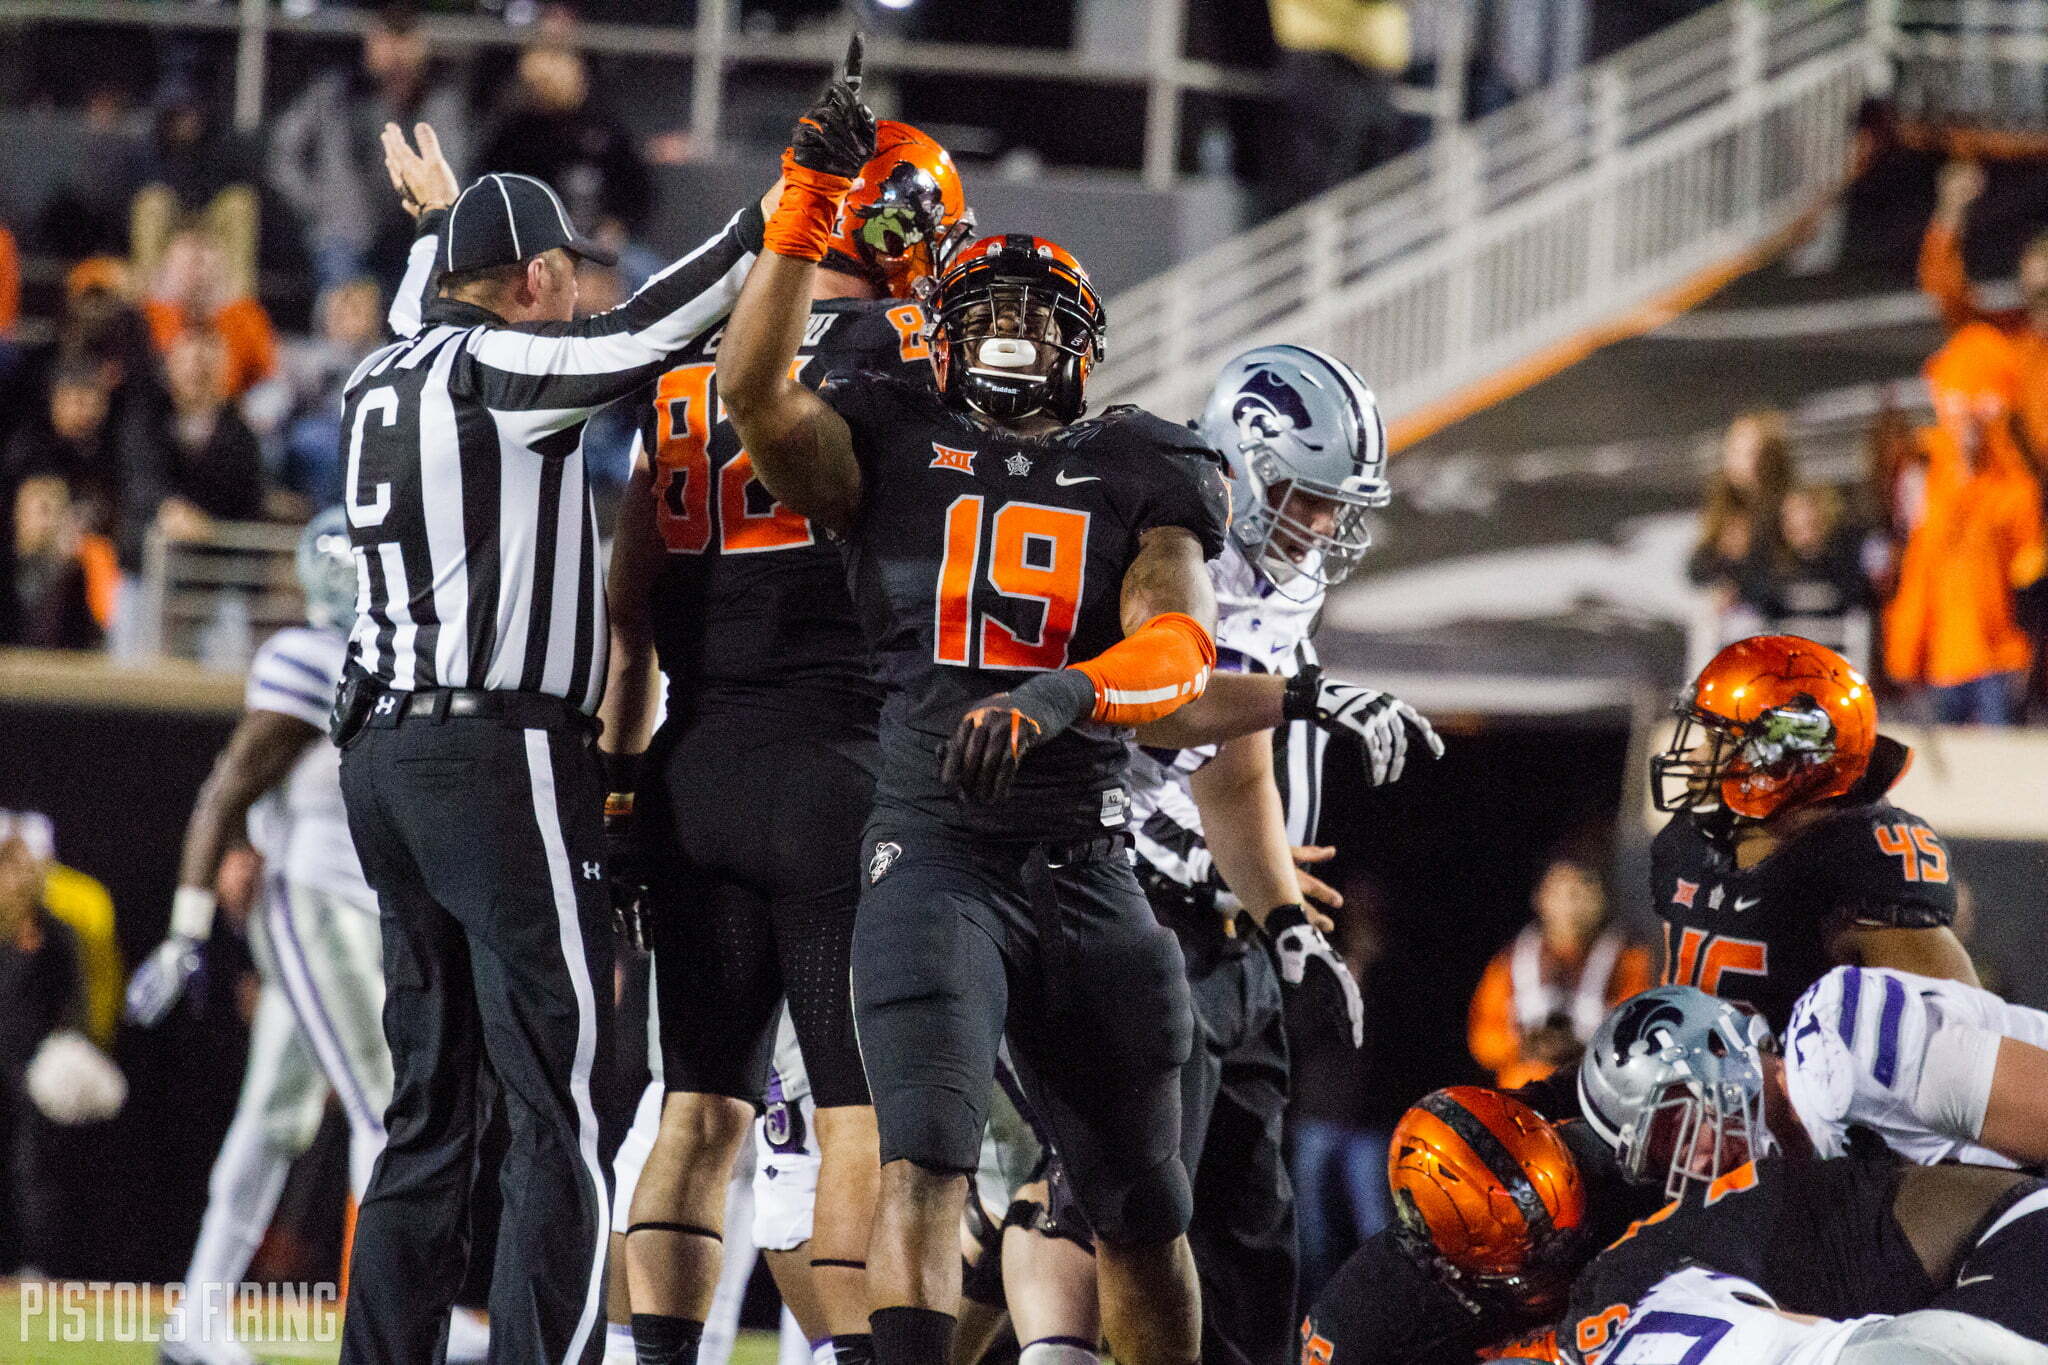
An example: OSU faced 128 drives on defense this year so its expected total point value was somewhere south of 274 points (128 x ~2.14, with the OSU offense taken out of the equation). It actually gave up 280 points or slightly more than the expected value. Divide that by number of games (9) and you get PF Defense. Got all that?
Let’s look at the numbers (lower is better here — 0.0 means you are an average Big 12 defense).
| Team | PF Defense |
|---|---|
| Texas | -12.4 |
| TCU | -11.5 |
| Iowa State | -7.5 |
| Oklahoma State | 1.8 |
| Kansas State | 2.4 |
| Texas Tech | 3.4 |
| Oklahoma | 3.5 |
| West Virginia | 5.3 |
| Baylor | 6.2 |
| Kansas | 9.6 |
So based on expected points given up and actual points given up … Oklahoma State ranked No. 4 in the conference. That doesn’t exactly mean they were good, but I think it tells a little different story than most people would have thought.
The reality here is that there were only three good defenses in the Big 12, and all three of them were very good. Texas held teams to nearly two touchdowns below what they would have been expected to score, and TCU was near that number. Iowa State held teams to just over a touchdown fewer per game (which is why I’ve been saying what OSU did in Ames was its most impressive offensive output all year).
Here are OSU’s game logs (again, lower is better).
| Expected | Actual | PF | |
|---|---|---|---|
| Baylor | 25.1 | 16 | -9.1 |
| Iowa State | 28.6 | 42 | 13.4 |
| Kansas | 13.6 | 17 | 3.4 |
| Kansas State | 32.5 | 38 | 5.5 |
| Oklahoma | 52.1 | 62 | 9.9 |
| TCU | 26.7 | 44 | 17.3 |
| Texas | 24.5 | 10 | -14.5 |
| Texas Tech | 25.0 | 27 | 2.0 |
| West Virginia | 35.5 | 24 | -11.5 |
Again, this is all drive-based data. So the number of drives you faced matters. Was OSU’s defensive performance on 15 drives against OU good? No, but it wasn’t nearly as bad as its defensive performance against TCU on just 13 drives given that TCU had one of the worst offenses in the league.
Anyway, people might not care about this stuff, but I think it’s pretty fascinating and a fun deep dive we don’t usually do based on drives and expected points scored. It shines a light on which games OSU’s defense showed up even though the final score might not show it. The best example? OSU giving up 24 defensive points to WVU on 16 drives. That is incredible, but because the final score was 50-39 nobody thinks of it as an amazing defensive showing (even if it was).

-

 Daily Bullets5 days ago
Daily Bullets (Apr. 23): Pokes Land Four-Star Quarterback, Retain Talent from Mike Boynton Era
-

 Hoops3 days ago
FIU Transfer Arturo Dean Commits to Oklahoma State
-

 Football4 days ago
The Top 5 Quotes from Mike Gundy’s Final Spring Practice News Conference
-

 Hoops2 days ago
Texas Tech Transfer Robert Jennings Commits to Oklahoma State


